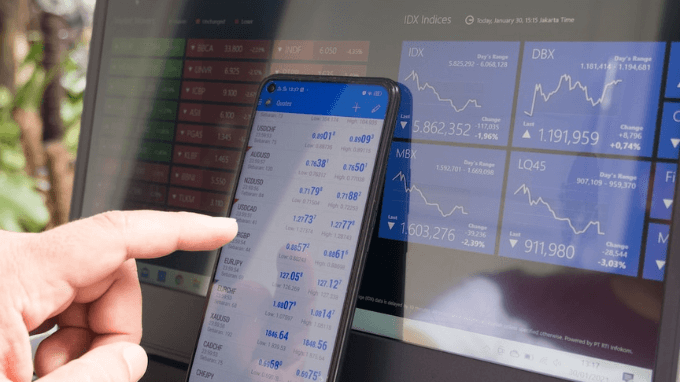
The foreign exchange market, often referred to as forex or FX, stands as the largest and most liquid financial market globally. With trillions of dollars exchanged daily, it offers a dynamic landscape for investors and traders seeking opportunities. Predicting forex movements is a fundamental skill, essential for making informed decisions and maximizing profits. While absolute certainty in predicting the forex market remains elusive, the utilization of various strategies and tools can significantly enhance your ability to make accurate forecasts.
I will cover quite a few topics in this post. Here’s a handy list so you can jump to the section you are most interested in:
Understanding the basics
Before delving into prediction techniques, it’s essential to grasp the fundamental factors that influence currency movements. Key elements include:
1. Economic indicators
Economic indicators are vital tools for predicting forex movements. These statistics provide insights into a country’s economic performance and can influence currency values.
- GDP growth: Gross Domestic Product (GDP) measures the total value of goods and services produced.. Higher GDP growth is generally associated with a stronger currency.
- Unemployment rates: Unemployment rates and non-farm payrolls reflect a country’s labor market conditions, impacting consumer spending and overall economic activity. Low unemployment rates are indicative of a robust economy, potentially strengthening the currency.
- Inflation rates: Central banks often target specific inflation rates. Deviations from these targets can impact currency values. Low and stable inflation rates are generally favorable for currency strength.
2. Interest rates
Central banks use interest rates to control inflation and stimulate economic growth. Changes in interest rates influence currency values:

- Interest rate decisions: Central banks set interest rates to control inflation and stimulate economic growth. Higher interest rates attract foreign capital, strengthening the currency.
- Interest rate differentials: Comparing interest rates between different currencies helps traders identify potential trading opportunities.
3. Political stability
Political stability is a key factor in forex prediction. Political events can create uncertainty, affecting investor confidence and currency values:
- Government stability: Political uncertainty and instability can lead to fluctuations in currency values. Elections, policy changes, and geopolitical events all play a role.
- Trade and economic policies: Government decisions regarding trade agreements, tariffs, and economic reforms impact currency strength.
4. Market sentiment
Traders’ perceptions and emotions contribute to market sentiment, influencing currency prices. Understanding sentiment can provide insights into potential market movements.
- Risk-on vs. risk-off sentiment: Traders’ appetite for risk influences currency values. In times of uncertainty, safe-haven currencies may strengthen.
- Economic confidence: Positive economic data fosters confidence in a currency, while negative data can lead to depreciation.
Technical analysis
Technical analysis is a powerful tool for predicting Forex movements, relying on historical price charts and statistical indicators. Traders use this method to identify patterns, trends, and potential reversal points, aiding decision-making.

1. Candlestick patterns
Candlestick patterns are visual representations of price movements over specific timeframes. These patterns provide insights into market sentiment:
- Doji: Signifying market indecision, a doji occurs when the opening and closing prices are nearly equal. It can indicate a potential reversal.
- Engulfing: This pattern involves one candlestick completely covering the previous one. An engulfing pattern often signals a strong reversal.
- Hammer: A single candlestick with a small body and a long lower shadow, resembling a hammer. It suggests a potential reversal, especially after a downtrend.
2. Support and resistance
- Support and resistance levels are crucial for understanding where prices might reverse or continue:
- Support: A price level where buying interest is historically strong. If the price approaches this level, it might bounce back.
- Resistance: A level where selling interest historically surfaces. Prices approaching resistance may stall or reverse.
3. Moving averages
Moving averages help smooth out price data, highlighting trends and potential reversal points:
- Simple Moving Average (SMA): Calculated by averaging prices over a specified period. SMAs provide a clear picture of the trend’s direction.
- Exponential Moving Average (EMA): Places more weight on recent prices, making it more responsive to short-term price changes.
4. Trend lines
Trend lines help identify and confirm trends, offering potential entry and exit points:
- Uptrend Line: Connects higher lows, indicating an upward trend.
- Downtrend Line: Connects lower highs, signaling a downward trend.
5. Bollinger bands
Bollinger Bands consist of a middle band being an N-period simple moving average, and upper and lower bands being N-period standard deviations away from the middle band. They help identify volatility and potential reversal points.
Fundamental analysis
Fundamental analysis is a cornerstone of forex trading, focusing on economic indicators, financial statements, and macroeconomic factors that influence currency values. By understanding the underlying forces that shape economies, traders can make informed predictions about future price movements.
1. Economic calendar
Staying informed about upcoming economic events is a fundamental aspect of forex trading:
- Central Bank announcements: Interest rate decisions, policy statements, and press conferences by central banks can cause significant market movements.
- Economic reports: Releases such as consumer price indices, manufacturing data, and retail sales figures provide insights into economic performance.
2. Interest rate differentials
Comparing interest rates between currencies is essential for fundamental analysis:
- Carry trade strategy: Traders may borrow in a low-interest-rate currency and invest in a higher-yielding currency to capitalize on interest rate differentials.
3. Political and economic news
Regularly monitoring news related to politics and economic policies is vital for fundamental analysis:
- Trade agreements: Changes in trade dynamics can impact currency values. Trade agreements and disputes influence forex movements.
- Policy changes: Governments’ decisions on fiscal and monetary policies can affect a currency’s strength.
Sentiment analysis
Sentiment analysis is a powerful tool that allows forex traders to gauge and interpret market sentiment, uncovering the collective emotions of market participants. By understanding how traders feel about a particular currency or market, one can gain valuable insights into potential future price movements.
1. Commitment of Traders (COT) report
The COT report is a valuable resource for sentiment analysis, providing a breakdown of the positions held by large institutional traders. Key elements include:
- Long positions: Reflect bullish sentiment among institutional traders.
- Short positions: Indicate bearish sentiment.
Analyzing the COT report can offer insights into potential trend reversals or continuations.
2. Social media and news sentiment
Monitoring social media platforms, news articles, and forums is a crucial aspect of sentiment analysis:
- Twitter, forums, and news articles: Public sentiment expressed on these platforms can influence market movements.
- Breaking news: Sudden news events can trigger rapid shifts in sentiment.
3. Economic events and announcements
Economic events and announcements can significantly impact market sentiment:
- Central Bank statements: Policy statements and press conferences can signal shifts in sentiment.
- Economic releases: Positive or negative economic data can influence sentiment.
4. Forex sentiment indicators
Several tools and indicators are specifically designed for measuring sentiment in the Forex market:
- Forex sentiment indicator: This tool aggregates data from various brokers, indicating the percentage of traders holding long or short positions.
- Fear and greed index: This index reflects market sentiment based on factors like volatility, put and call options, and market momentum.
5. Contrarian approach
The contrarian approach involves going against the prevailing sentiment:
- Crowd psychology: When the majority of traders are positioned in one direction, it may signal an impending reversal.
- Extreme sentiment: If sentiment reaches extreme levels, it may indicate a potential market turning point.
Using forex indicators
Forex indicators are essential tools that empower traders to analyze market trends, identify potential entry and exit points, and make informed decisions.
1. Relative Strength Index (RSI)
The Relative Strength Index (RSI) is a momentum oscillator that measures the speed and change of price movements. Here’s how to utilize the RSI:
- Overbought and oversold conditions: RSI values above 70 indicate overbought conditions, potentially signaling a reversal. Conversely, values below 30 suggest oversold conditions, indicating a possible upward correction.
- Divergence: Divergence between RSI and price movements can signal potential trend reversals.
2. Moving Average Convergence Divergence (MACD)
The MACD is a trend-following momentum indicator that illustrates the relationship between two moving averages of a security’s price:
- Signal line crossovers: MACD crossovers with its signal line can indicate potential trend changes.
- Histogram analysis: Histogram bars above or below the zero line represent the difference between the MACD and its signal line, offering insights into the strength of a trend.
3. Bollinger bands
Bollinger bands consist of a middle band being an N-period simple moving average and upper and lower bands being N-period standard deviations away from the middle band:
- Volatility analysis: Widening bands indicate increased volatility, while narrowing bands suggest decreasing volatility.
- Overbought and oversold conditions: Prices near the upper band may be overbought, while those near the lower band may be oversold.
4. Fibonacci retracement
Fibonacci retracement levels help identify potential reversal levels:
- Key retracement levels: Traders commonly use the 38.2%, 50%, and 61.8% retracement levels to anticipate price reversals.
- Support and resistance: Fibonacci retracement levels can act as support or resistance, influencing price movements.
5. Support and resistance
Support and resistance levels are crucial for identifying potential reversal or continuation points:
- Horizontal levels: Identify historical price levels where the market has reacted strongly.
- Trendlines: Draw trendlines to identify dynamic support and resistance levels.
6. Moving averages
Moving averages help smooth out price data and identify trends:
- Golden cross and death cross: The golden cross (short-term moving average crossing above a long-term moving average) and death cross (short-term moving average crossing below a long-term moving average) are trend reversal signals.
- Slope analysis: The slope of moving averages can indicate the strength and direction of a trend.
Risk management
Effective risk management is a cornerstone of successful forex trading, ensuring that traders protect their capital, minimize potential losses, and navigate the markets with discipline.
1. Setting risk tolerance
Before diving into specific risk management strategies, it’s crucial to establish your risk tolerance. Consider factors such as:
- Financial goals: Define your short-term and long-term financial objectives.
- Risk appetite: Assess how comfortable you are with taking risks.
- Trading style: Different trading styles may require different risk approaches. Day traders may have different risk tolerance than swing or position traders.
2. Position sizing
Determining the size of each position is a fundamental aspect of risk management. Consider:
- Percentage risk per trade: Decide on a fixed percentage of your trading capital that you are willing to risk on a single trade. Commonly, this ranges from 1% to 3%.
- Volatility considerations: Adjust position sizes based on the volatility of the currency pair. More volatile pairs may require smaller positions to manage risk.
3. Stop-loss orders
Implementing stop-loss orders is a key risk management tool, ensuring that losses are limited:
- Dynamic stops: Adjust stop-loss levels based on market conditions, such as support and resistance levels or volatility.
- Trailing stops: As a trade moves in your favor, trail the stop-loss to lock in profits while still managing risk.
4. Diversification
Diversifying your trading portfolio helps spread risk across different assets and reduces vulnerability to specific market movements:
- Currency pairs: Avoid concentrating on a single currency pair. Diversify across various pairs to mitigate risk.
- Asset classes: Consider including other financial instruments like stocks or commodities to further diversify your portfolio.
5. Risk-reward ratio
The risk-reward ratio is a critical concept in risk management, comparing the potential loss to the potential gain in a trade:
- Minimum 1:2 ratio: Aim for a risk-reward ratio where the potential reward is at least twice the amount of the risk.
- Realistic targets: Set profit targets based on market conditions and avoid overly optimistic expectations.
6. Managing leverage
Leverage can magnify both gains and losses, making it essential to use it judiciously:
- Leverage limits: Adhere to leverage limits and avoid excessive exposure.
- Understand margin requirements: Be aware of the margin requirements of your broker and how they impact your trading.
7. Regularly review and adjust
Markets evolve, and effective risk management requires ongoing evaluation and adjustment:
- Periodic assessments: Regularly review your trading performance, risk exposure, and overall strategy.
- Adapt to market conditions: Adjust your risk management approach based on changes in market volatility, economic conditions, or geopolitical events.
8. Psychological discipline
Maintaining psychological discipline is integral to successful risk management:
- Emotional control: Stick to your risk management plan even during periods of heightened emotions, such as fear or greed.
- Learn from mistakes: Analyze losing trades objectively and use them as learning opportunities to refine your risk management strategy.
Conclusion
Successfully predicting forex movements requires a combination of technical analysis, fundamental analysis, and an understanding of market sentiment. Continuous learning, staying informed about global economic events, and using the right tools are essential for developing effective prediction strategies. Remember, no strategy guarantees success, so incorporating risk management practices is paramount for long-term success in the dynamic world of forex trading.