
Navigating the world of Forex trading can be thrilling yet challenging, especially for beginners. With so many tools available, it’s important to understand how each one can improve your trading strategy and decision-making process. Whether you’re just starting or looking to refine your skills, knowing the right tools to use can greatly impact your success in the forex market.
In this guide, we’ll cover the essential Forex trading tools that every new trader should know about. We’ll discuss trading platforms, charting tools, technical indicators, and risk management strategies. By the end of this post, you’ll have a solid understanding of these tools and how to use them effectively, setting you up for a successful Forex trading journey.
1. Trading Platforms
Trading platforms are the electronic mediums where all your transactions take place. Most brokerage firms offer a variety of these platforms to cater to different needs and preferences. Traders often have the option to connect multiple devices to some of these platforms, enhancing accessibility and flexibility. In a shared system, there is generally no need to download any specific platforms, as they are often accessed via web-based interfaces. However, in a personal system, you can download a platform and tailor it to suit your individual preferences and trading style. Additionally, platforms that are compatible with mobile devices enable traders to conduct transactions on the move, providing greater convenience and accessibility.
Below are the famous trading platforms that traders use in daily basis to trade.
- MetaTrader 4 (MT4) and MetaTrader 5 (MT5): Popular platforms offering advanced charting tools, technical indicators, and automated trading capabilities. They support multiple order types and customizable interfaces.
- cTrader: Known for its intuitive interface and advanced charting tools. It also supports automated trading through cAlgo.
- TradingView: Provides powerful charting tools and social networking features, allowing traders to share and view trading ideas.
2. Charting Tools
Charting tools are essential for traders and investors to analyze market data and make informed decisions. Here are some popular charting tools and platforms you might find useful:

- TradingView: Offers advanced charting features with various indicators and drawing tools. It also provides social features to share and discuss trading ideas.
- MetaTrader 4/5 (MT4/MT5): Widely used platforms that provide comprehensive charting capabilities, technical indicators, and automated trading options.
- Thinkorswim: A powerful trading platform by TD Ameritrade with extensive charting tools and technical analysis features.
- NinjaTrader: Known for its advanced charting and analysis tools, as well as support for algorithmic trading strategies.
- eSignal: Offers professional-grade charting, real-time data, and extensive technical analysis tools.
- Investing.com: Provides a wide range of charting tools, including various indicators and drawing tools, along with real-time data and news.
- StockCharts: Provides detailed charting options and technical analysis tools, with a focus on stocks and ETFs.
- ProRealTime: Offers advanced charting features with a wide range of technical indicators and drawing tools, along with trading automation capabilities.
These tools can help you analyze price trends, patterns, and technical indicators, and can be integrated with trading strategies for better decision-making.
3. Technical Indicators
Technical indicators are tools used by traders to analyze price movements and forecast future price trends. They are based on historical price and volume data and help in identifying patterns, trends, and potential buy or sell signals. Here are some common types of technical indicators:
- Moving Averages (MA): These smooth out price data to help identify trends. Simple Moving Average (SMA) and Exponential Moving Average (EMA) are popular types.
- Relative Strength Index (RSI): Measures the speed and change of price movements. It ranges from 0 to 100 and is used to identify overbought or oversold conditions.
- Moving Average Convergence Divergence (MACD): Shows the relationship between two moving averages of a security’s price. It is used to identify changes in the strength, direction, momentum, and duration of a trend.
- Bollinger Bands: Consist of a middle band (SMA) and two outer bands (standard deviations above and below the SMA). They help to identify volatility and potential overbought or oversold conditions.
- Stochastic Oscillator: Compares a security’s closing price to its price range over a specific period. It helps to identify overbought or oversold conditions.
- Fibonacci Retracement: Uses horizontal lines to indicate areas of support or resistance at the key Fibonacci levels before the price continues in the original direction.
- Ichimoku Cloud: Provides information about support and resistance levels, trend direction, and momentum. It consists of five lines: Tenkan-sen, Kijun-sen, Senkou Span A, Senkou Span B, and Chikou Span.
- Average True Range (ATR): Measures market volatility by calculating the average of the true ranges over a specific period.
- Volume: Indicates the number of shares or contracts traded in a security or market. Volume analysis helps confirm trends and chart patterns.
- Parabolic SAR (Stop and Reverse): Used to determine the direction of an asset’s momentum and potential reversal points.
Each indicator has its strengths and weaknesses, and they are often used in combination to get a clearer picture of market conditions.
4. Economic Calendars
Economic calendars are essential tools for traders and investors to track important economic events and data releases that can impact the financial markets. These calendars list scheduled events, such as economic reports, central bank meetings, and other significant activities, along with their expected dates and times. Here’s a quick overview of what you might find on an economic calendar:
- Economic Indicators: Data releases like GDP, inflation rates (CPI, PPI), unemployment figures, and manufacturing indices. These indicators help gauge the health of an economy.
- Central Bank Meetings: Announcements from central banks, such as interest rate decisions, monetary policy statements, and press conferences. These can significantly influence currency markets.
- Corporate Earnings Reports: Quarterly financial results from publicly traded companies, which can impact stock prices and market sentiment.
- Political Events: Elections, referendums, or geopolitical developments that could affect market stability and economic outlook.
- Market Surveys: Business sentiment surveys, consumer confidence indices, and other market-related surveys that provide insights into economic conditions.
Economic calendars usually include the expected impact level of each event (high, medium, or low) and actual outcomes versus expectations. Traders use this information to anticipate market movements and make informed trading decisions.
- Forex Factory Calendar: Provides information on upcoming economic events and their expected impact on currency pairs.
- Investing.com Calendar: Offers detailed economic data, including interest rate decisions, employment reports, and GDP releases.
5. Risk Management Tools
Risk management tools are essential for traders and investors to protect their capital and manage potential losses. Here are some commonly used risk management tools:
- Stop-Loss Orders: These orders automatically sell a security when its price falls to a certain level, limiting potential losses. It helps in protecting against significant drops in asset prices.
- Take-Profit Orders: These orders automatically sell a security when its price reaches a specified level of profit, securing gains before they can evaporate due to market fluctuations.
- Trailing Stops: This type of stop order moves with the market price and locks in profits as the price moves in a favorable direction. If the price reverses by a certain amount, the trailing stop triggers, selling the security.
- Position Sizing: This involves determining the amount of capital to risk on a single trade based on your risk tolerance and the size of your trading account. It helps in managing how much you can afford to lose on a trade.
- Risk-Reward Ratio: This is a measure of the potential reward for a trade compared to the risk. A favorable risk-reward ratio helps ensure that potential gains outweigh potential losses.
- Diversification: Spreading investments across different assets or asset classes to reduce the risk associated with any single investment. This can help in mitigating the impact of adverse movements in individual investments.
- Hedging: Using financial instruments, such as options or futures, to offset potential losses in other investments. Hedging strategies can help manage risk in volatile markets.
- Risk Assessment Tools: Software and platforms that analyze and quantify risk based on historical data and market conditions. They can provide insights into potential risks and help in making informed decisions.
- Volatility Measures: Tools like the VIX (Volatility Index) help gauge market volatility and potential risk levels, enabling traders to adjust their strategies accordingly.
- Margin Management: Keeping track of margin levels to ensure they are within acceptable limits. Proper margin management helps avoid margin calls and forced liquidations.
Using these tools effectively can help manage risk, protect your capital, and improve the overall performance of your trading or investment strategy.
6. Trading Signals
Trading signals are tools used by traders to make informed decisions about when to enter or exit trades in the financial markets. These signals can be generated through various methods, including:
- Technical Analysis: Signals based on chart patterns, technical indicators (like moving averages, RSI, MACD), and price action.
- Fundamental Analysis: Signals derived from economic data, company earnings, news events, and other fundamental factors that might impact market prices.
- Algorithmic or Automated Systems: Signals generated by trading algorithms or software that analyze large amounts of data to identify trading opportunities.
- Expert Analysis: Recommendations provided by experienced traders or analysts based on their market expertise and analysis.
- Sentiment Analysis: Signals based on the overall sentiment or mood of the market, often gauged through news, social media, and other sources.
- Signal Services: Third-party providers offering trading signals as a service, either through subscription or as part of a trading platform.
When using trading signals, it’s crucial to verify their reliability and to understand the methodology behind them. Here are some tips for evaluating trading signals:
- Transparency: Reliable signals services often provide clear information about their track record and the methodology used to generate signals.
- Performance Tracking: Look for evidence of past performance, though past performance is not always indicative of future results.
- Integration with Your Strategy: Ensure that the signals align with your trading strategy and risk tolerance.
- Trial and Testing: Consider testing signals with a demo account or on a small scale before committing significant capital.
7. Demo Accounts
A demo account is a simulated trading environment offered by brokers where traders can practice trading with virtual money. It mimics real market conditions but does not involve actual financial risk.
Benefits of Using a Demo Account
- Practice Without Risk: You can test trading strategies, learn platform features, and understand market dynamics without financial risk.
- Familiarization: Helps in getting comfortable with the trading platform and its tools.
- Strategy Testing: Allows you to refine trading strategies and techniques before applying them with real money.
- Market Understanding: Provides a chance to observe market behavior and learn how different factors affect price movements.
How to Use a Demo Account Effectively
- Treat it Seriously: Even though you’re trading with virtual money, approach it with the same seriousness as you would with real funds.
- Simulate Real Conditions: Try to simulate real trading conditions as closely as possible, including setting realistic goals and managing virtual funds as if they were real.
- Analyze Performance: Regularly review your trades and performance to understand what works and what doesn’t.
- Experiment and Learn: Use the demo account to test new strategies and understand how different market conditions affect your trading decisions.
Transitioning from Demo to Live Trading
- Gradual Transition: Start with smaller amounts when moving to live trading to manage risk and get accustomed to real market conditions.
- Continuous Learning: Keep learning and adapting based on your live trading experiences.
- Emotional Management: Be aware that real trading involves emotional aspects that a demo account might not fully replicate.
8. Automated Trading Systems
Automated Trading Systems (ATS) are software programs designed to execute trades on behalf of traders based on pre-defined criteria. These systems use algorithms to analyze market data, identify trading opportunities, and execute trades automatically. Here are some key aspects of ATS:
i.) Components of Automated Trading Systems:
- Algorithm: The core of an ATS, which defines the trading strategy and rules.
- Market Data Feed: Provides real-time or historical data needed for the algorithm to make decisions.
- Execution System: Executes the trades based on the algorithm’s signals.
- Risk Management: Monitors and manages risks according to pre-set parameters.
ii.) Types of Automated Trading Systems:
- High-Frequency Trading (HFT): Executes a large number of orders at very high speeds.
- Algorithmic Trading: Uses algorithms to trade at optimal times and prices.
- Expert Advisors (EAs): Automated trading scripts for MT4/MT5 that execute trades based on specific criteria. They can handle tasks such as entry, exit, and risk management.
iii.) Advantages:
- Speed: Executes trades faster than manual trading.
- Emotionless Trading: Removes emotional biases from trading decisions.
- Backtesting: Allows for testing strategies on historical data before applying them to live markets.
- Consistency: Follows predefined rules, leading to more consistent trading strategies.
iv.) Disadvantages:
- System Failures: Technical issues can lead to unexpected losses.
- Over-Optimization: Strategies might be overfitted to historical data and perform poorly in live markets.
- Lack of Adaptability: May not adapt well to sudden market changes or news events.
- Monitoring Required: Even automated systems need periodic monitoring and adjustment.
v.) Key Considerations:
- Strategy Development: Developing a robust and profitable trading strategy is crucial.
- Testing: Extensive backtesting and forward testing are necessary to ensure effectiveness.
- Regulation and Compliance: Ensure that the ATS complies with relevant regulations and guidelines.
If you’re considering using or developing an ATS, focusing on these aspects can help you build a more effective and reliable system.
9. Fundamental Analysis Tools
Fundamental analysis tools help traders and investors evaluate the intrinsic value of assets by examining economic, financial, and other qualitative and quantitative factors. Here are some key tools and resources commonly used in fundamental analysis:
- Economic Indicators:
- GDP (Gross Domestic Product): Measures the total economic output of a country. Strong GDP growth can indicate a healthy economy.
- Inflation Rates: Indicated by Consumer Price Index (CPI) or Producer Price Index (PPI). High inflation can affect purchasing power and interest rates.
- Employment Data: Includes unemployment rates and non-farm payrolls. Employment data can provide insights into economic health and consumer spending.
- Company Financial Statements:
- Balance Sheet: Shows a company’s assets, liabilities, and shareholders’ equity. It helps assess financial health and stability.
- Income Statement: Provides information on revenues, expenses, and profits. Key metrics include net income, operating income, and earnings per share (EPS).
- Cash Flow Statement: Details cash inflows and outflows from operating, investing, and financing activities. It helps evaluate liquidity and cash management.
- Valuation Ratios:
- Price-to-Earnings (P/E) Ratio: Compares a company’s share price to its earnings per share. A higher P/E ratio may indicate overvaluation.
- Price-to-Book (P/B) Ratio: Compares the market value of a company’s stock to its book value. It helps identify undervalued or overvalued stocks.
- Dividend Yield: Shows the annual dividend paid by a company as a percentage of its share price. It indicates the return on investment from dividends.
- Industry and Sector Analysis:
- Industry Reports: Provide insights into industry trends, competitive landscape, and growth prospects.
- Sector Performance: Analysis of sector-specific factors and trends can help identify potential investment opportunities.
- Macro-Economic Analysis:
- Central Bank Policies: Interest rate decisions, monetary policy statements, and economic projections from central banks can influence market conditions.
- Trade and Fiscal Policies: Government policies on trade, taxation, and spending can impact economic performance and market sentiment.
- Qualitative Analysis:
- Management Team: Evaluates the experience, track record, and leadership of a company’s management team.
- Competitive Advantage: Assesses a company’s unique strengths, such as patents, brand recognition, or cost advantages.
- News and Events:
- Corporate News: Earnings reports, product launches, mergers, and acquisitions can impact a company’s stock price.
- Economic Events: Economic data releases, geopolitical events, and policy changes can affect market dynamics.
These tools provide a comprehensive view of an asset’s value and help inform investment decisions based on fundamental factors.
10. Social Trading Platforms
Social trading platforms are online platforms that allow traders to follow and copy the trades of experienced investors. They integrate social networking features with trading, enabling users to share trading strategies, insights, and results. Here’s a brief overview of some key aspects of social trading platforms:
Features:
- Copy Trading: Users can automatically replicate the trades of top traders. This feature is useful for beginners who want to leverage the expertise of more experienced traders.
- Social Network Integration: Platforms often include social feeds where users can discuss strategies, share trading tips, and engage with a community of traders.
- Performance Tracking: Users can view detailed performance metrics of traders they follow, including historical performance, risk levels, and trading styles.
- Trading Signals: Some platforms offer trading signals or recommendations based on the strategies of successful traders.
Popular Social Trading Platforms:
- eToro: Known for its user-friendly interface and extensive social trading features. It allows users to copy the trades of top investors and engage with a global trading community.
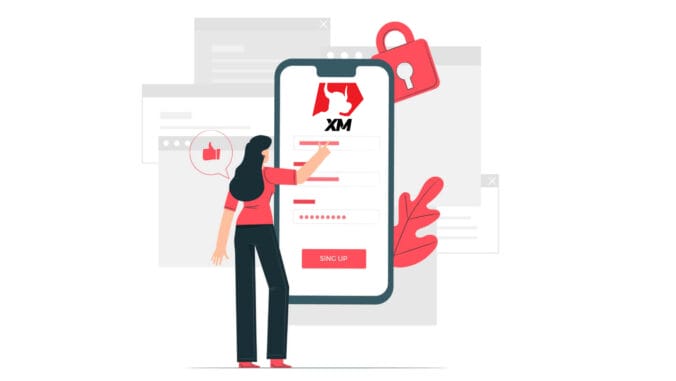
- XM: Allows traders to copy the trades of successful traders. It’s a way to leverage the experience of others while learning about trading strategies.
- ZuluTrade: Focuses on connecting traders and investors through social trading. It offers various tools for performance analysis and trade copying.
- HFM: Integrates with the their trading platform, offering users the ability to follow and copy the strategies of successful traders.
- TradingView: While primarily known for charting and analysis, it also has social features where traders share ideas and strategies.
Benefits:
- Accessibility: Provides beginners with access to trading strategies and techniques they might not have the expertise to develop on their own.
- Learning Opportunity: Users can learn by observing the trades of successful traders and analyzing their strategies.
- Diversification: Allows users to diversify their trading approach by following multiple traders with different strategies.
Considerations:
- Risk Management: Copying trades doesn’t guarantee success. It’s essential to understand the risk profile of the traders being followed.
- Due Diligence: Users should research and evaluate the performance and risk levels of traders before copying their trades.
- Costs and Fees: Be aware of any fees associated with social trading platforms, such as copy trading fees or subscription costs.
Social trading platforms can be a valuable tool for both novice and experienced traders, offering a way to leverage the expertise of others while engaging with a trading community.
11. News Feed
For a financial news feed, you’ll want to include updates on market trends, economic indicators, corporate earnings, geopolitical events, and other relevant financial information. Here’s a general outline you could follow:
- Market Summary: Overview of major stock indices (e.g., S&P 500, Dow Jones, NASDAQ), commodity prices (e.g., oil, gold), and forex rates.
- Economic Indicators: Updates on key indicators such as GDP growth, unemployment rates, inflation data, and central bank interest rate decisions.
- Corporate Earnings: Highlights from recent earnings reports, including major companies’ performance and outlook.
- Geopolitical Events: News affecting global markets, such as trade agreements, political instability, and international sanctions.
- Market Trends: Analysis of current trends in different sectors or asset classes, including any emerging opportunities or risks.
- Expert Opinions: Insights and predictions from financial analysts and market experts.
- Forex Market Updates: Recent developments in currency exchange rates, including factors influencing forex movements.
- Bitcoin and Crypto News: Updates on cryptocurrency market trends, regulatory news, and technological developments.
If you wish to know where we receive news from you can check out our sources. Platforms like Bloomberg or Reuters provide real-time news that can impact currency prices. You have to choose to filter relevant news for the currency pair or an asset you are trading.
12. Forex Brokerage
Forex brokerage refers to the services provided by firms that facilitate trading in the foreign exchange (forex) market. Forex brokers act as intermediaries between individual traders and the forex market. They offer various services, including:
- Trading Platforms: Brokers provide access to trading platforms where traders can execute buy and sell orders on currency pairs. Popular platforms include MetaTrader 4 (MT4), MetaTrader 5 (MT5), and proprietary platforms developed by the brokers.
- Leverage and Margin: Brokers often offer leverage, allowing traders to control larger positions with a smaller amount of capital. They also require margin, which is the initial deposit needed to open and maintain a trading position.
- Spreads and Commissions: Brokers earn through the difference between the bid and ask prices (spread) or through commissions on trades. Some brokers offer fixed spreads, while others have variable spreads.
- Account Types: Brokers may offer different account types, such as standard, mini, and micro accounts, catering to various trading styles and capital levels.
- Customer Support: Brokers provide customer support to assist traders with account management, trading issues, and technical problems.
- Educational Resources: Many brokers offer educational materials, webinars, and trading guides to help traders improve their skills and knowledge.
- Research and Tools: Brokers may provide access to market research, analysis tools, and trading signals to aid in decision-making.
When choosing a forex broker, it’s important to consider factors such as regulation, trading costs, available currency pairs, and the quality of customer service.
Conclusion
Understanding and effectively utilizing these Forex trading tools can significantly enhance your trading experience. Begin by familiarizing yourself with each tool and practicing with a demo account to build confidence before trading with real money.


I found your article very helpful, thank you so much for your content.
Kevin, you are most welcome. Keep visiting our blog to get more information.