Support and Resistance Levels
Along a trend, there are points that function as barriers that block the trend, until the price succeeds in breaking through them. Imagine actual gates which do not let anyone pass through as long as they are locked. Eventually, someone will succeed in breaking them down or climbing over them. The same applies to price. It has a tough time breaking these barriers, called support and resistance levels. 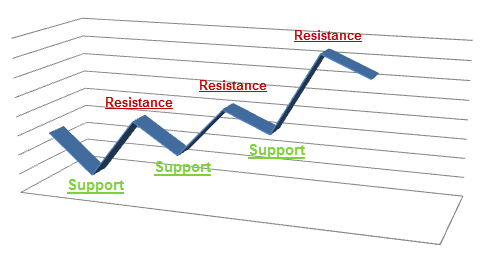 The lower barrier is called the Support Level. It appears as a final or temporary end of a bearish trend. It expresses sellers’ exhaustion when they no longer succeed in reducing the price anymore. At this point, buying forces are stronger. It is the lowest point of a current downtrend on the charts. The upper barrier is called the Resistance Level. It appears at the end of a bullish trend. The resistance level means that sellers are becoming stronger than buyers. At this point, we are going to witness a trend reversal (Pullback). It is the highest point of a current uptrend on the charts. Support and resistance levels are very useful tools to assist both beginners and experienced traders, for several reasons:
- Very easy to spot them because they are highly visible.
- They are covered continuously by the mass media. They are an integral part of the Forex jargon, making it very easy to obtain live updates on them, from news channels, experts, and Forex sites, without having to be a professional trader.
- They are highly tangible. In other words, you do not have to imagine them or create them. They are very obvious points. In many cases, they help determine where the current trend is heading.
Important: Support and Resistance levels are the strongest reasons for the “Flock Trade”: this is the self-fulfilling phenomenon whereby traders effectively create the market scenario they want. So when a potential point is about to appear on the chart, many speculative forces open or close positions, causing large price movements. Pay attention! If you are using Candlestick charts, shadows might also point to support and resistance levels (we are about to see an example). Important: Resistances and supports are not exact points. You should think of them as areas. There are cases where the price drops above or below the support level (which should indicate a continuation of the downtrend), but shortly after it comes back, going up again. This phenomenon is called a Fake-out! Let’s see how support and resistance levels look on the charts: 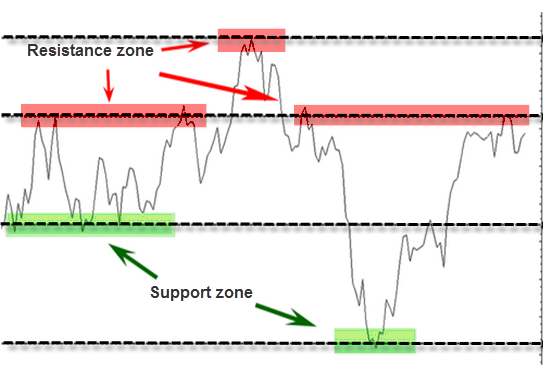 Our real challenge as professional traders is to determine which of the levels we can rely on and which ones we cannot. In other words, knowing which levels are solid enough to stay unbreakable for the time being and which ones are not that is a true art! There is no magic here and we are not Harry Potter. It requires lots of experience, plus use of other technical tools. However, support and resistance levels work at a relatively high probability, especially solid levels that have been used as barriers at least 2 times in a row. Sometimes, even if the price has only been rejected once at some level, that level might turn into support/resistance. This usually takes place on longer timeframe charts or near-round numbers like 100 in USD/JPY or 1.10 in EUR/USD. But, the more times the price gets rejected at one level the stronger that level becomes.
 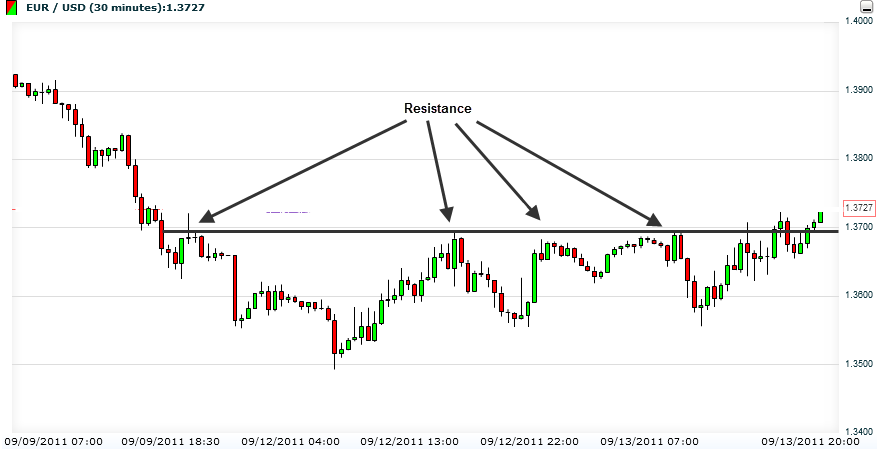 In many cases, once broken, a support level turns into a resistance level and vice versa. See the next chart: after using a Resistance Level 3 times (notice that on the third time it blocks long shadows), the red line eventually breaks and turns into a support level.
 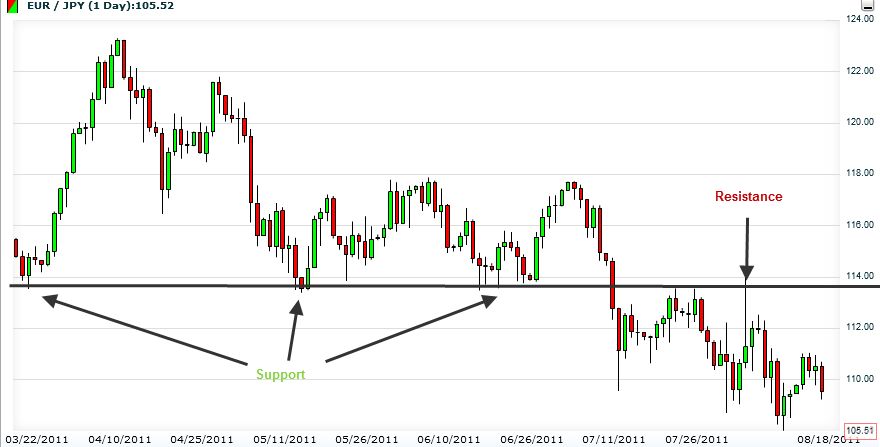 Important: When the price hits the support/resistance level, it is advisable to wait for more than just one stick to appear (wait until there are at least 2 sticks in the sensitive zone). It will strengthen your confidence while helping to determine where the trend is going. Once again, the challenge is guessing when to buy or sell. It is difficult to decide on the next support/resistance level and to decide on where a trend ends. Therefore, it is very hard to be sure when to open or close a position. Tip: One good way to cope with tough situations like these is to count backward 30 bars, next, locate the lowest bar out of the 30 and treat it as Support. In conclusion, you are going to use this tool so many times in the future. It fits together perfectly with other indicators, which you will be learning about later on. Breakouts are situations when support and resistance levels are broken by the price! Breakouts can have several causes, for example, a news release, changing momentum or expectations. The important thing for you is to try to recognize them in time and plan your moves accordingly. Remember: There are 2 behavior options when breakouts occur:
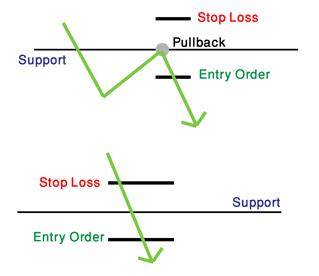
- Conservative – Wait a bit while price breaks level, until it reverse back to level. Right there is our signal to enter trade! This maneuver is called a Pullback
- Aggressive – Wait until price breaks level to execute a buying/selling order.
Breakouts represent changes in supply/demand ratios for currencies. There are Reversal and Continuation Breakouts. The next graphs demonstrate breakouts on a forex chart in a clear, simple way: 
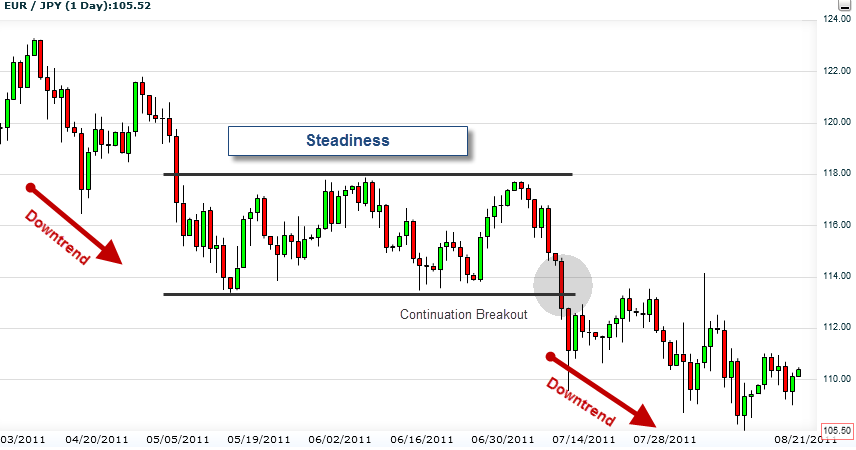 False Breakouts (Fake-outs): They are the ones to be careful of, because they make us believe in false trend directions! Tip: The best way to use breakouts is to be a bit patient while price breaks level, to watch where the wind is blowing. If another peak on an uptrend (or a low on a downtrend) appears right after, we can reasonably guess that it is not a False Breakout. In this chart, we are using a Trend line Forex Trading Strategy:
  You will notice the trend line breaks. Let’s wait a bit, to be sure that we are not witnessing a False Breakout. Check out the new peak (the second circle after the breakout), which is lower than the breakout circle. This is exactly the signal we have been waiting for in order to open a bearish position!
- In the following chapters, we will get back to this subject of support and resistance and explore it a little more, to understand how to use those points on a strategic level.