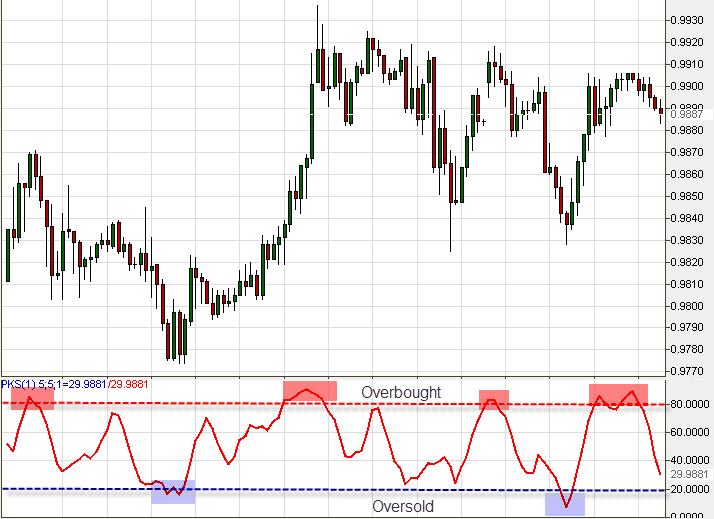
Stochastic Indicator
This is another Oscillator. The Stochastic informs us of a potential end of trend. It helps us avoid Oversold and Overbought market conditions. It works well in all timeframe charts, particularly if you combine it with other indicators such as trend lines, candlestick formations, and moving averages. Stochastic also operates on a 0 to 100 scale. The red line is set on point 80′ and the blue line on point 20′. When the price declines beneath 20′, the market condition is Oversold (selling forces are out of proportion, namely there are too many sellers) – time to set a Buy order! When the price is over 80′ – the market condition is overbought. Time to set a Sell order! For instance take a look at the USD/CAD, 1 hour chart:  Stochastic works the same way as RSI. It is clear on the chart how it signals upcoming trends.