Course Content
Introduction to Forex Market
Start with the basics; what is the forex market, who are the key players, learn about market structure and size, what are the advantages of forex trading, and why you should trade forex. Learn how to setup a free practice account so you can try everything you learn.
0/8
Basic Terminology
Learn the basic terminology used while trading forex. Get familiar with basic terms such as currency pairs, types of orders, pips, spreads, margins, and leverage.
0/2
Synchronize Time and Place for Forex Trading
Delve into what is traded in the forex market, major currency pairs, cross currencies, and exotic pairs. Find out when the forex market is the most active and how money is made from trading.
0/2
Get Equipped for Forex Trading
Familiarize yourself with the basic tools needed to successfully trade forex. Learn how to analyze charts, trend lines, and time-frames. Discover what trading strategies are at your disposal, such as; scalping, day trading, long vs. short trading, swing trading, and many more.
0/4
Fundamental Forex Trading Strategies
Discover the factors that most commonly influence the market and what impact they can have on your trading decisions. Learn how and when to use fundamental analysis, and the importance of a good economic calendar which details upcoming economic events.
0/3
Technical Forex Trading Strategies
Learn how to use technical analysis to evaluate the market and acquire a better understanding of the most popular trading strategies. You’ll learn about price action, support and resistance levels, chart patterns, and the importance of technical analysis.
0/4
Fibonacci Technical Indicator
The Fibonacci Indicator is one of the most commonly used indicators. Receive an in-depth explanation of what the Fibonacci indicator is and how to use it when trading. Start creating your personal trader's toolbox.
0/2
More Technical Trading Indicators
A profitable trader has many tools at his disposal. Learn about the essential tools used by traders such as; Moving Averages (MA), Relative Strength Index (RSI), Stochastic, Bollinger Bands, Parabolic SAR, ADX, and Pivot Points.
0/9
Killer Combinations for Trading Strategies
The key to using forex indicators is to which to use together. Learn more about the Elliott Wave prediction pattern, divergence trading, carry trading, currency correlation strategies, and retracement/reversal strategies. Learn which indicators to use together for the best results.
0/9
Forex in Relation to Stocks and Commodities and Trading with MetaTrader
Learn about the inter-relationship between stocks, commodities, and indices to the forex market. Take your first steps and learn how to master the MetaTrader trading platform.
0/3
Forex Trading Course
About Lesson

RSI (Relative Strength Index)

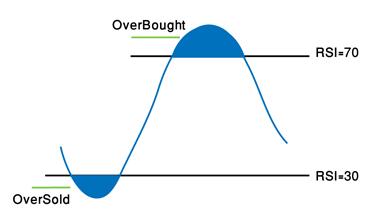
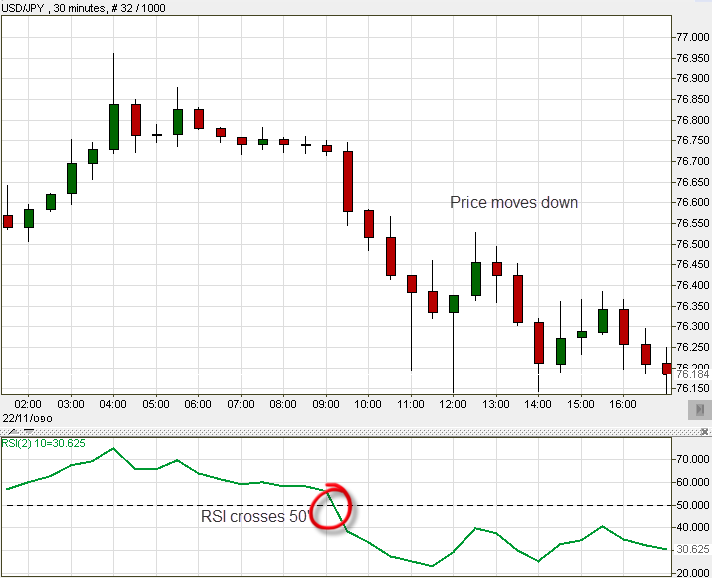
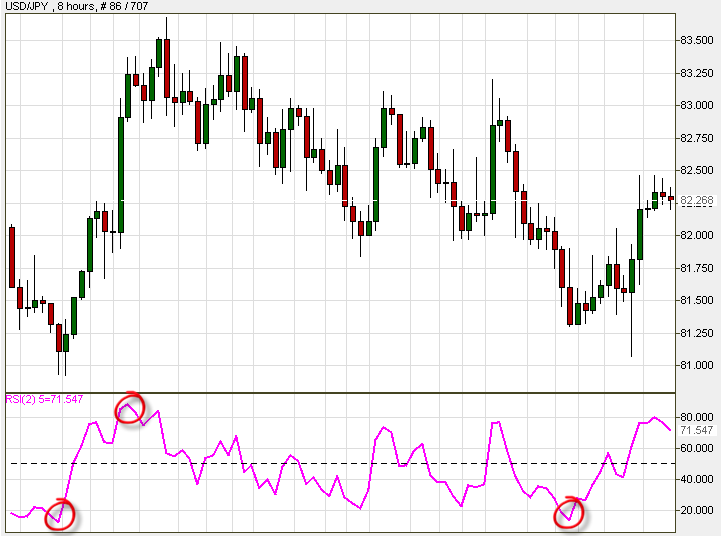
One of the few Oscillators that you will learn about. RSI operates as an elevator that moves up and down on the market’s momentum scale, checking a pair’s strength. It belongs to the group of indicators that are presented beneath the chart, in a separate section. RSI is very popular among technical traders. The scale on which RSI moves is 0 to 100. Strong milestones are 30′ for oversold conditions (price below 30′ sets an excellent Buy signal), and 70′ for overbought conditions (price above 70′ sets an excellent Sell signal). Other good points (although riskier, for more aggressive traders) are 15′ and 85′. Conservative traders prefer to work with point 50′ for identifying trends. Crossing 50′ indicates that the reversal has been completed. RSI - overbought oversold Let’s see how it looks on the trading platform: RSI live example On the left-hand side, higher than 70′ the RSI signals a coming downtrend; crossing the 50′ level confirms the downtrend, and going below 30′ indicates on an oversold condition. Time to think of exiting your SELL position. Pay attention on the next chart to breached points 15 and 85 (circled), and to the following change in direction: Break of Moving Average
Stochastic Indicator

Shopping Cart