Price Action
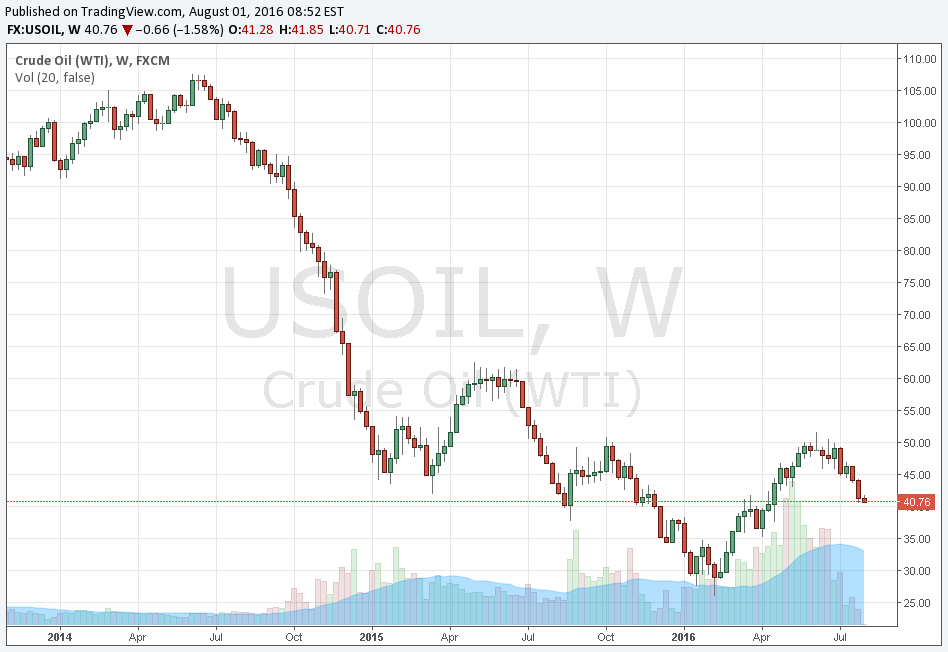
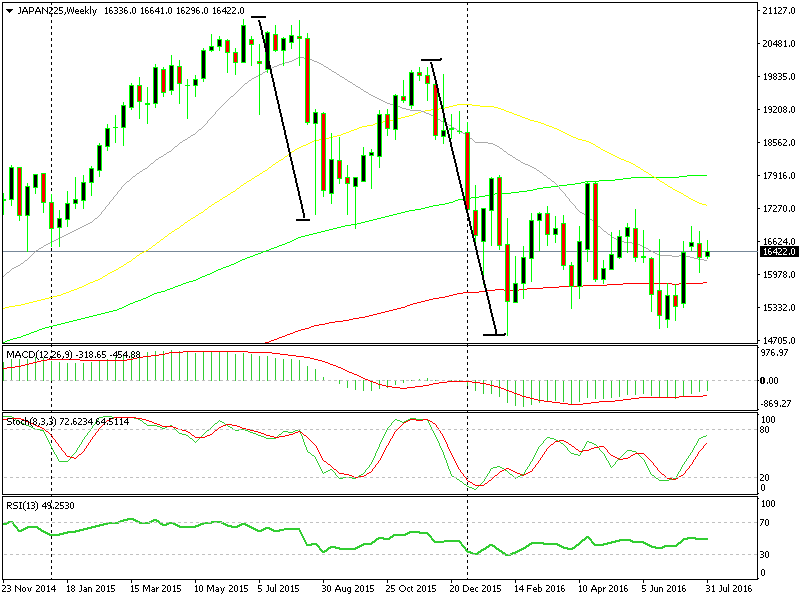
You already figured out that prices change continuously. For years, technical analysts have tried to study the patterns behind market trends. Over the years, traders have improved technical methods that help them follow and predict changes, called trading the price action. Important: At any given time, unexpected fundamental events might appear and break all the existing patterns on which we base our trades. Fundamentals can sometimes cast doubt on our technical analysis. Commodities and stock indices are mostly affected by fundamentals. When fears of another global recession prevailed from 2014 to early 2016, the price of oil kept declining and the technical indicators were just small bumps along the way.  The same happened to the stock indices. Take a look at the Nikkei 225; it went through all the moving averages and support levels like a knife through butter during the Chinese stock market crash in August 2015, and again in January and February 2016 amid global financial worries.
  Because of the above, we recommend that you do not base all your trades on the following patterns, although they are still excellent tools for predictions. Recognizing the patterns you are going to learn about would be very useful. Sometimes a trend will progress exactly according to pattern. As simple as that… Wouldn’t it be amazing if we could figure how a price is going to behave at any given time?? Well, forget it! We do not have any miracle solutions. We still have not found the tool that predicts market trends 100% (unfortunately)… But the good news is that we are going to introduce you to a box full of helpful patterns. These patterns are going to serve you as great analytical tools for price movements. Experienced traders follow trend directions, as well as their strength and timing! For instance, even in case you guessed right that a bullish trend is about to appear, you should figure out where to enter, so you do not make mistakes. Patterns are very important in these cases.