About Lesson
Parabolic SAR
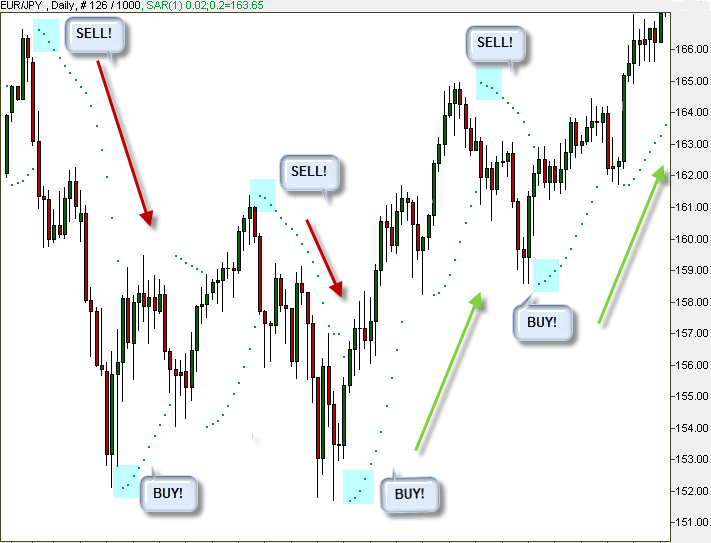
Distinguished from indicators which identify trends’ beginnings, the Parabolic SAR helps identify trends’ endings. This means, the Parabolic SAR catches price changes and reversals on a particular trend. SAR is extremely simple and friendly to use. It appears in the trading chart as a dotted line. Search for the areas where the price cuts the SAR dots. When the Parabolic SAR goes above the price, we sell (Uptrend ends), and when the Parabolic SAR goes below the price we buy! EUR/JPY:  Important: The Parabolic SAR is well suited to markets which are characterized by long-term trends. Tip: The correct way to use this method: once SAR changes sides with price, wait for three more dots to form (as in the highlighted boxes) before executing.