In Chapter 9, we will show you which trading strategies you can combine to get the best results (two is usually better than one).
- Elliott Wave: Prediction pattern
- Divergence Trading: Predict the future
- Trading plan: Retracement/Reversal Strategy
- Opening and closing position: Two simple trading strategies
- Currency Correlation: Fundamental Strategy – play your currencies like a game of chess
- Carry Trade: Great alternative strategy
Combining Indicators
In the previous lesson, we introduced the important technical indicators. We also encouraged using two to three indicators simultaneously before deciding on a trend and what action to take, but not more. You learned about the technical indicators and saw examples of how they work individually. But, as we mentioned in the previous lessons in this course, the best way to build a forex strategy is to combine indicators. Now let’s take a look at six winning (in our opinion) combinations of forex indicators to wrap up this subject:
Moving Average + Stochastic
This is one of our favorite and most popular trading strategies for short-term trading and often for long-term signals. As you can see, the stochastic is overbought, and the price is right below the 100 moving average before it turns south. This is a very effective forex strategy, especially if there are candlestick formations. It is also a primary trading strategy in the indices and commodity markets. 
Bollinger Bands + Stochastic

MACD + RSI

Parabolic SAR + EMA
 Parabolic SAR + Stochastic
Fibonacci + MACD

Be Careful!
We showed you some examples to demonstrate how using technical tools helps us determine trends, future directions, entries and exits and other necessary market data. Is everything that easy? Are we living in a perfect world? Of course not! The first problem is that alerts coming from the market are sometimes wrong. Imagine you’re an NBA player. Your team plays against Kobe Bryant and the L.A. Lakers. Your coaches are not suckers; they will prepare a game plan and analyze your rivals by watching tapes and statistics. Assume that analysis shows that during the last five games, Kobe took an average of 7 three throws and also scored 90% from the line. They also know he likes to go to the basket from the right side with his left hand. Coaches will prepare you to try and compete with these facts due to the high probability that these numbers and data will be similar during the game tomorrow night. Do you have guarantees that it will work? Are you fully confident that Kobe will follow these numbers? Of course not! Regardless, it is advised to prepare yourself. The same goes for trading. Indicators are very efficient, but they might be mistaken and mislead you. Take the next chart, for example, which contains two indicators – EMA (on the chart) and MACD (Beneath it):  You can see from the chart that the signals were wrong! On the left-marked spot on the chart, MACD (Buy) gets it wrong- you can notice the price decline right after the BUY signal. On the right marked spot, EMA gets it wrong- it doesn’t provide any signal for a coming uptrend, while MACD does provide the correct BUY signal. Another problem is that there are times when different indicators provide different signals. Another example with three indicators on the chart – Stochastic, RSI (both beneath the chart), and Parabolic SAR (on the chart):
 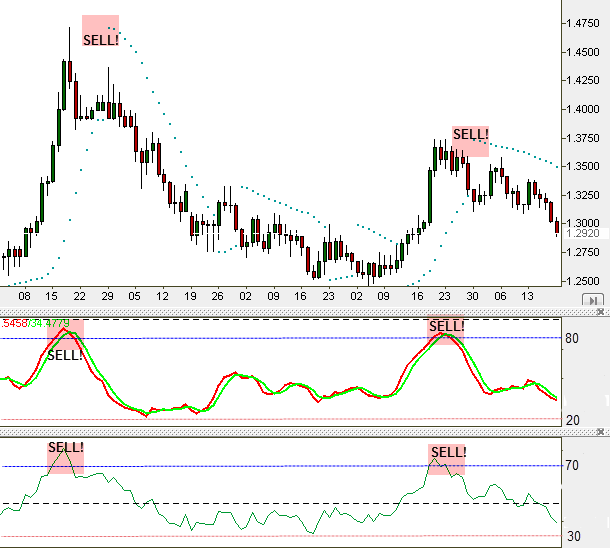 You can see that all the indicators point us towards the same actions. Bravo! It is a pleasure doing business with you… Onward, let’s check the indicators and follow the alerts.
  Here, on the other hand, the case is different. The Parabolic SAR + Stochastic + RSI show that indicators often do not correlate with each other which can cause confusion among traders. In case each indicator gives you different alerts, it is better not to make any move at all! Wait for other opportunities. If you want to open a position anyway – go with the majority.
Elliott Wave – Prediction Pattern
One of the critical fundamentals of technical analysis is named after Ralph Nelson Elliott, an economist. This is an identification technique for trade patterns. It serves as a good tool for predicting trends’ directions. The Elliot Wave Theory works on the wave motion principle – traders fluctuate in natural, continuing, repeated motions, like a sequence of waves crashing onto the beach. We refer to the waves as stages. In each stage of the eight stages, build a single motion that can last different periods (you will get it in 3 minutes, don’t worry). Psychologically, traders usually react similarly to each wave. These reactions create a pattern whose continuation can be foreseen. Elliot discovered a relatively harmonic, distinct motion that kept repeating itself. Problem – Many traders rely too much on this pattern, and putting all your eggs in one basket is wrong! In addition, in many cases, Elliott waves are hard to identify. Traders make recognition mistakes and wrong interpretations of the charts. Let’s see what an Elliott Wave Pattern looks like on the following charts: 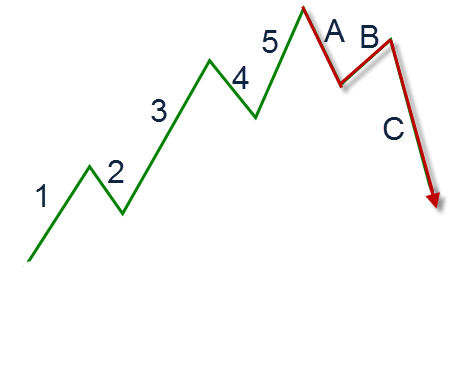
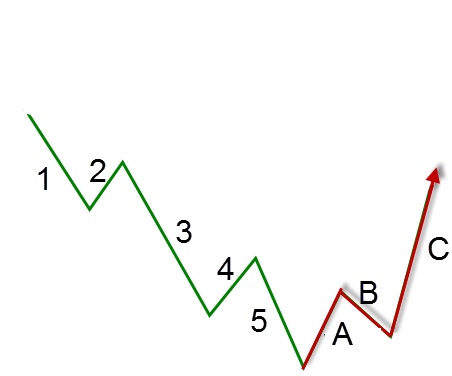 You can see that the pattern is assembled at the first major trend (in this case- uptrend), built of 5 stages (Waves 1 to 5), and a smaller secondary trend (in our case a downtrend), built of 3 stages (Waves A to C). Some rules:
- Wave #2 will never pass the starting point of wave #1;
- Wave #3 will never be the shortest of the five stages that build the first trend;
- Wave #4 will not enter the price range of wave #1. Assuming an uptrend, it will always end higher than wave #1’s top;
- Wave #2 and wave #4 usually end around Fibonacci ratios
Pay attention to all 8 stages of the Elliot Wave in the following chart: 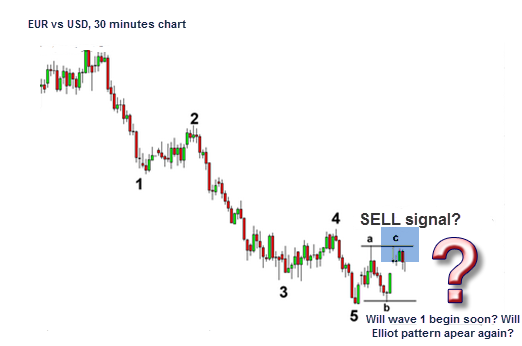 Will the pattern repeat itself? Bingo!
 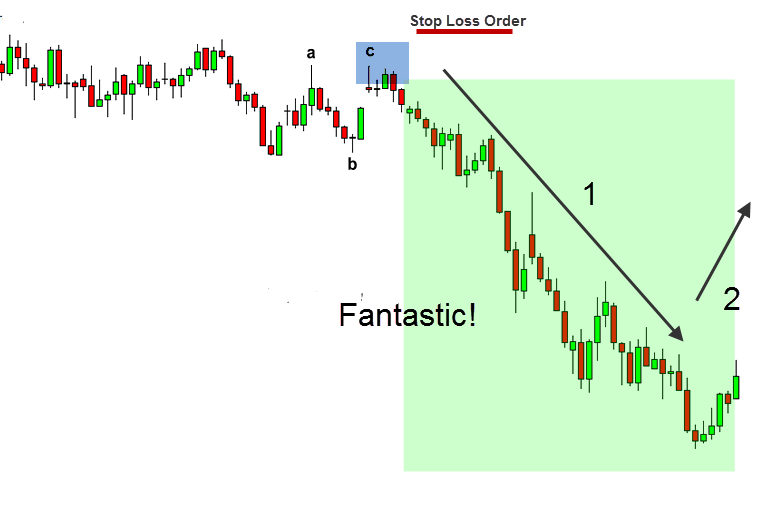 Identifying an Elliot Wave in time can produce great profits! Here is a nice example of identifying the opening point of wave #3 with Fibonacci’s help (Ratio 0.618):
 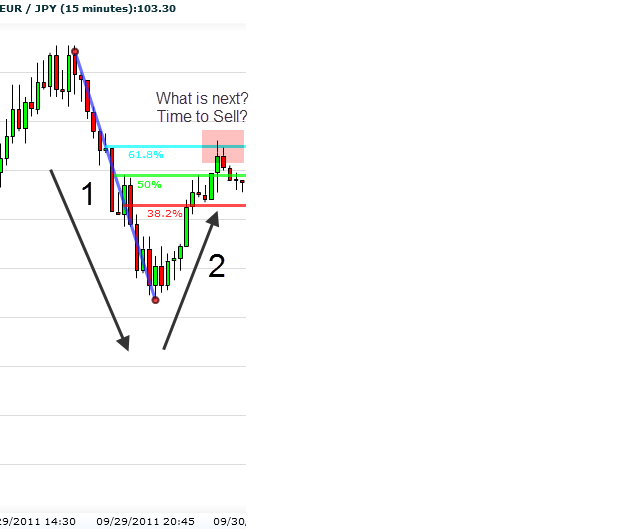 Let’s see what happens next:
  In most cases, the wave’s height is approximately the same as the three main Fibonacci ratios (.50, .382, and .618).
Divergence Trading- Predict the Future
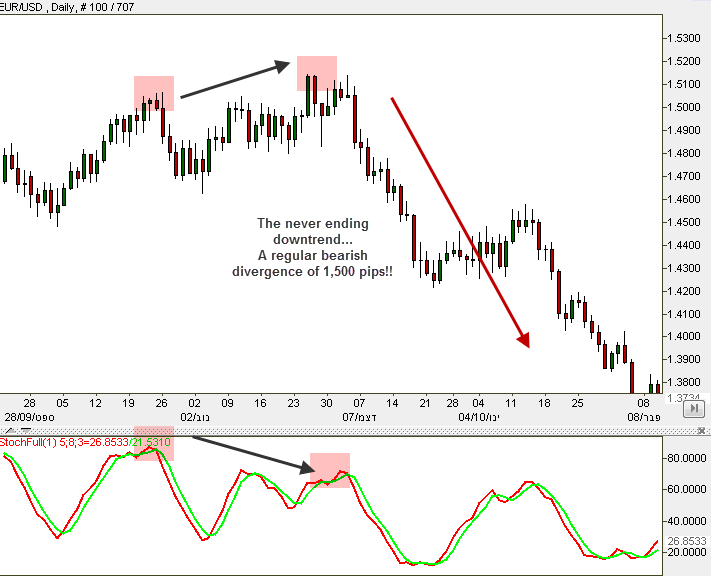
Wouldn’t it be great if you could predict future events? Say, the winning numbers in the next lottery? Let’s not get carried away… We can’t admit that we know how to do it (we are not Harry Potter), but Divergence Trading Strategies help us predict further price movements. Divergence happens when the directions on the price chart and on the indicating graph split. When divergence occurs, it helps us determine whether we are witnessing a good exit/entry point. Divergence trading allows us to wait with our executions until right near the ultimate point on the trend and, by doing so, enlarge profits and reduce risks simultaneously! How can you do this in practice? Simply compare price movement on the chart to what the indicator shows. Let’s meet two types of divergences and check how they work: Regular Divergence – Informs us that the pair is weakening and the trend is about to end. A good indication for change in the trend’s direction. When the price moves from a high to a higher high, and the indicator moves from a high to a lower high, you should prepare yourselves for a bearish divergence: 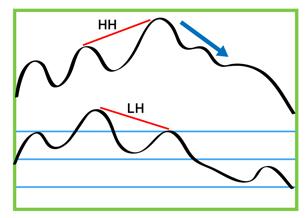 When the price moves from a low to a lower low, and the indicator moves from a low to a higher low, you should prepare yourselves for a bullish divergence:
  Remember: An indicator that is acting contrary to the price is alerting us to price weakening and a possible change in momentum! Example: Let’s see how Regular Divergence looks on a real chart, using Stochastic.
 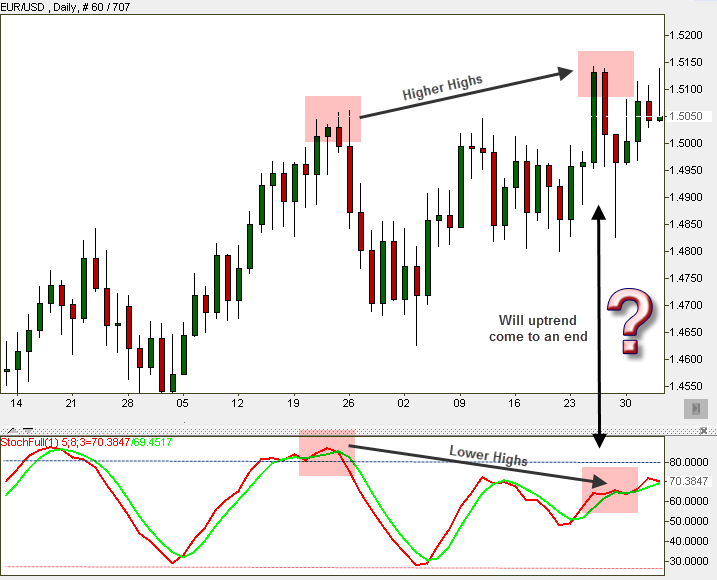 You will notice the perfect “HH/LH Regular Divergence”. This type of divergence signals a coming reversal to the downtrend. Is that what is going to happen here? Let’s see: ↓
  Hidden Divergence – a sign of an expected continuation of a certain trend. The next graph signals a bullish hidden divergence:
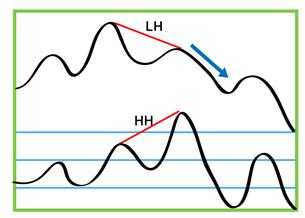
 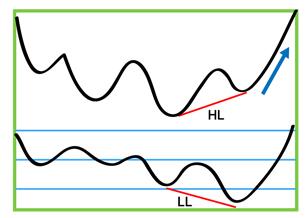 Pay attention to the price, which moves from a low to a higher low, and the indicator that moves from a low to a lower low. In this case, the graph signals a continuing uptrend. The next drawing shows a bearish hidden divergence and signals the continuation of price decline:
  Example on the EUR/USD, 1-hour chart: Let’s see how hidden divergence looks on a real chart, using Stochastic:
 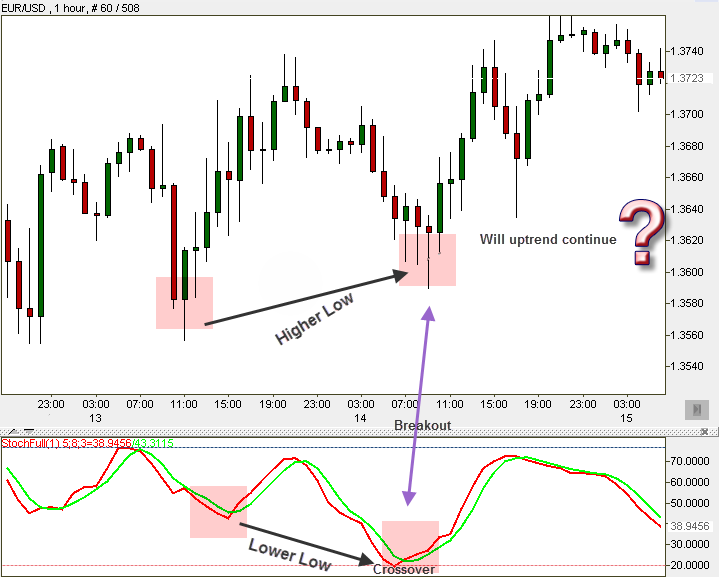 You can notice the perfect “HL/LL Hidden Divergence”. This type of divergence signal is a continuation of the uptrend. Is that what is going to happen here?
  Tip: Divergence is much more effective for long-term trades. Remember: Recommended indicators for using the Divergence method are mainly MACD, RSI, and Stochastics. Here, we sometimes use divergence for our long-term forex trading signals. Divergence – Do Not Forget:
- To draw lines. The gap between the price’s two highs or the two lows needs to be clear, without interruptions.
- Use an appropriate indicator.
- Compare the attached line on the price chart to the attached line on the indicator’s graph.
- If you notice a divergence too late, no worries! Be patient and wait for the next one to appear.
Retracement and Reversal Strategy
Retracements usually occur when a pair reaches the three Fibonacci ratios – 61.8%, 50%, or 38.2%, and stops before returning to its overall direction. If the price crosses all of these levels and passes 61.8%, there might be a good chance for a reversal. Let’s watch an example in the pair EUR/CHF: 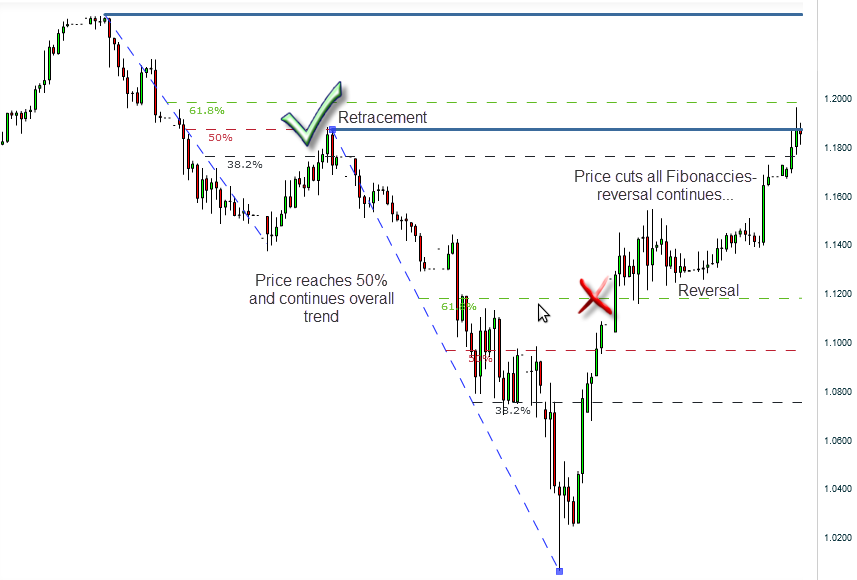 Another good tool is the Trendline Trading Strategy. If being cut by the price, we are possibly about to witness a reversal:
  Experienced traders already know a thing or two about the currencies. They know that, in many cases, major pairs get to their daily peaks during the rush hours of the early N.Y. sessions when the London session is still open. They also know that using several indicators, they could already guess the general areas on the chart in which the price would tire, slow down, reverse, and move back to its daily average zone. One more thing they can do is to find the daily average price range of a certain pair along a chosen period (by using the ADR tool for calculation of average daily pips! Suppose ADR shows that a specific price range during the past 20 days has been 120 pips a day- unless something dramatic happened today. In that case, we can safely assume that it would be today’s approximate range and tomorrow’s, and so on until some major fundamental event occurs and affects the market. Trading example: First, we consider some important data on the chart to the current point. In our example, we trade on the London session. The chart below is a 10 min. Chart (Each candlestick represents 10 minutes). The chart represents the 5-hour frame: 8 am to 1 pm GMT (London time). What does this mean? It means that during the last hour, the N.Y. session started and joined the London session. Anyway, we wish to find the daily average price range. This will indicate the price along a whole activity day throughout all sessions. The chart below shows that during today’s opening hour in London, the price was 1.2882.
  Next, assume we are talking here on the pair EUR/USD. You will notice the downtrend during the London session. The price goes down to a 1.279 low and rises back a bit to 1.2812 just after the N.Y. session starts. Now, we used the ADR tool and found out that the daily average pips range for this pair during the past 20 days stands at 120 pips per day. What does this mean? It means that we can now focus on our chart’s max and min points so far: The point is 1.2882, and the min point is 1.2789. We can use them to calculate possible supports and resistances later that day during the N.Y. session. A possible support level would be 1.2762 (1.2882-120), and a potential resistance level would be 1.2909 (1.2789+120). So far so good, right? Well, now comes the tricky part. This is the expertise step. If you wish to trade like pros, it’s necessary to recheck and verify your strategy: We will now examine our pair on Multiple Time Frames. Check out our pair on a 2-hour chart (Each candlestick represents 2 hours). That way, we could see if the possible support and resistance we calculated are approximately the same as the ones here or if they are different.
 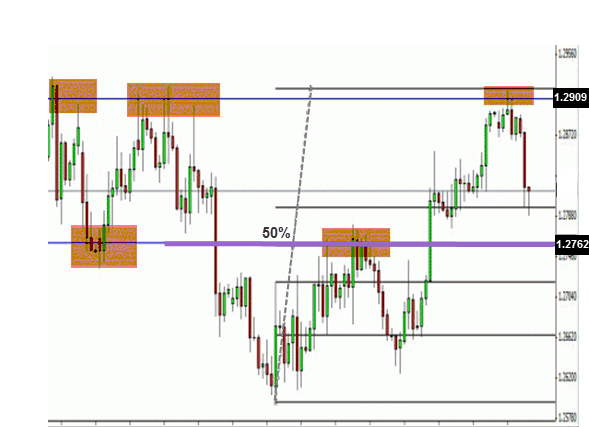 Remember, Fibonacci and Pivot Points are the most efficient indicators for retracement/reversal Strategy. Well, our suspicions were verified! You can see on the chart that 1.2909 is indeed a strong resistance level! Pay attention to what happens on 1.2762- It sits precisely on top of the 0.5 Fibonacci ratio! Notice that at first it is used as a support, and when it is breached, it turns into resistance. We expect it to become a support level again later during the current N.Y. session! We have an outstanding trading plan for the rest of the day! We figured out where the support and resistance are going to be, and we figured out the daily price range. We are set to go. Now, we know that this particular paragraph was a bit harder. Take your time to let it sink in. Another indicator that works well with this strategy is Pivot Points. If the price breaks the supports or resistances, there might be a good chance for reversal. As long as the price doesn’t break all 3 pivots, we will witness a retracement to the general trend: