Fibonacci Trading Strategy + Trend Lines:
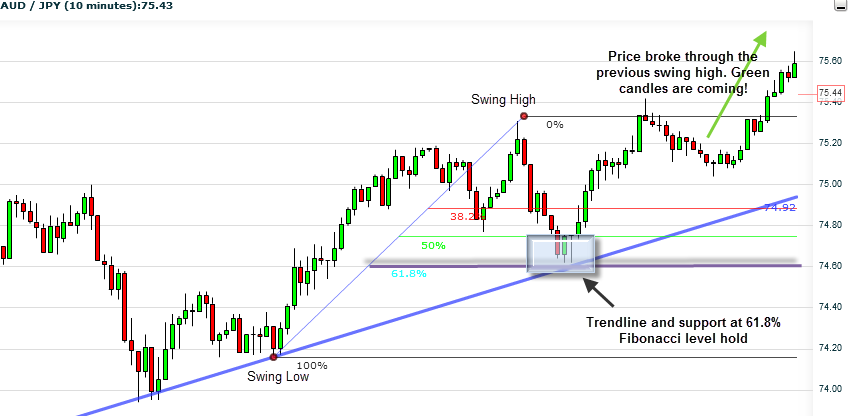
Fibonacci works best in times of high activity (Trendy market). Therefore, it makes sense that it works fantastically together with trend lines. We need to pay attention to trends, to identify them. You constantly need to remember that if trends are sticking out, you are probably not the only one to notice them. Other traders are probably watching them too, this is a good thing! Example: Watch this chart (AUD/JPY): 
Fibonacci Trading Strategy + Candlesticks:
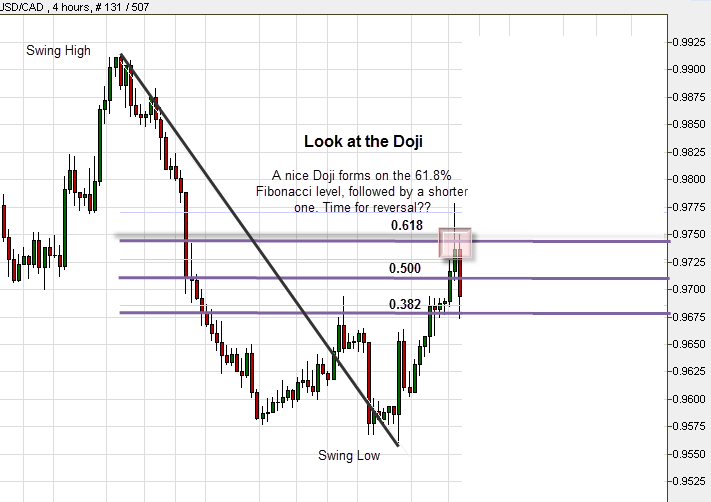
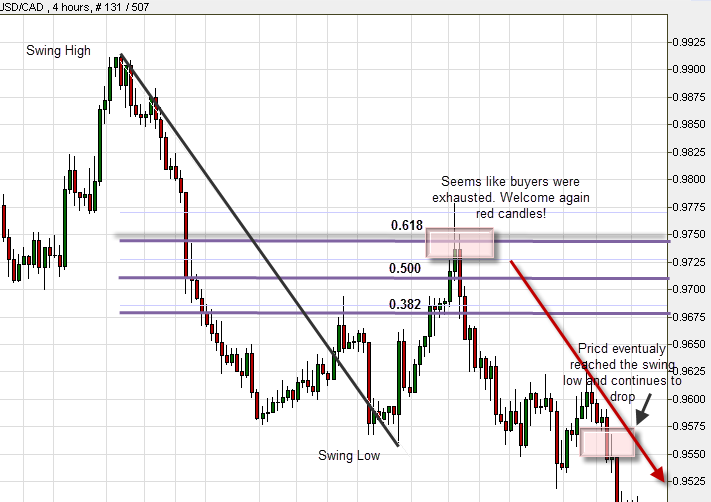
Tip: You should be aware of Dojis (do you remember the candlesticks trading strategy?). Dojis tend to signal a trend ending soon, by describing a situation where buyers or sellers are getting tired, with a good chance of transferring the momentum to the other direction. Follow the next example in the sequential charts:  ↓
↓  Important: Don’t get confused. Fibonacci is a fantastic technical indicator, but it is time to remind you that no indicator on earth works 100%! There are going to be occasions when we will have difficulties determining which points are Swing Lows and Swing Highs (in other words, when does a trend begin and when does it end?). Each trader is unique, with a view and commentary of his own. Each trader analyses the charts a bit differently. That is why we recommend using it in conjunction with one of the additional technical indicators you are going to learn about in the next lesson. After all, it is a bit of a guessing game. Our goal is to increase probabilities for successful guesses as much as we can. That’s why we advise that you add other technical indicators when you use the Fibonacci retracement levels and mix them with the fundamental analysis as well. To sum up: We can honestly state that Fibonacci is our most highly recommended indicator. Its accuracy and prediction capabilities are high, it is very reliable, it is easy to integrate with other technical indicators, and it makes it easy to spot levels and trends, such as supports, resistances, and reversals.
Practice
Go to your Demo account. If you don’t have one yet use our definitive guide to forex brokers to choose one. Now let’s practice Fibonacci on the platform:
- Find Fibonacci on the platform (look for the technical indicators tab at the top of the chart). Click on the indicator and then click at the ‘swing low’ of the price. Hold and drag the cursor to the swing high. Discover how it appears on the chart.
- Identify the main ratios on different kinds of charts and time frames.
- With the help of Mr. Fibs, try to guess the point at which a reversal trend will appear.
- Add Trend lines to the chart. Play with them a bit and try to open demo positions.