The Fibonacci Indicator
In the next two chapters, you will receive a detailed introduction to your technical toolbox. Every professional has his own working tools and so do Forex traders. Our toolbox contains a variety of analytical tools. These tools are helpful for efficient, professional technical analysis (which at the same time, in many cases, support fundamental decisions). Remember: Toolbox is usually in the “Tools” or “Indicators” sections on top of the charts.
Fibonacci Technical Trading Strategy
The most popular technical indicator among Forex traders. Dear Fibonacci was an Italian mathematician (although his name sounds more like a type of pasta), who discovered existing ratios and patterns of number sequences. So what did Fibonacci find out? Looking at his sequence of numbers, we notice that the sum of any sequential instruments equals the following instrument. Confused? Check out the following serial: 1, 1, 2, 3, 5, 8, 13, 21, 34, 55, 89… 1+1=2 1+2=3 2+3=5 … 21+34=55 And so on… Impressed? It is not over yet! Additional ratios are derived from this rule, bringing us to the Fibonacci ratio: By dividing a number by its sequential, we obtain a ratio of 0.382. 5/13= 0.382 This ratio is our Retracement Level when using the Fibonacci indicator strategy. You will soon figure out what we are talking about. In order to understand Fibonacci, you need to understand what this tool examines: have you ever asked yourselves why prices do not move in a straight line? Why are they so frantic? Why do they move all the time, changing directions? Prices move in motions that mimic waves. It is impossible to explain each and every price movement because there are too many of them, but explaining general price movements is another story. Prices always move in trends – waves! While the fundamental approach tries to explain long-term trends, we are going to focus on shorter trends. Sometimes, they can be completely explained using technical tools. This is what a standard trend looks like: 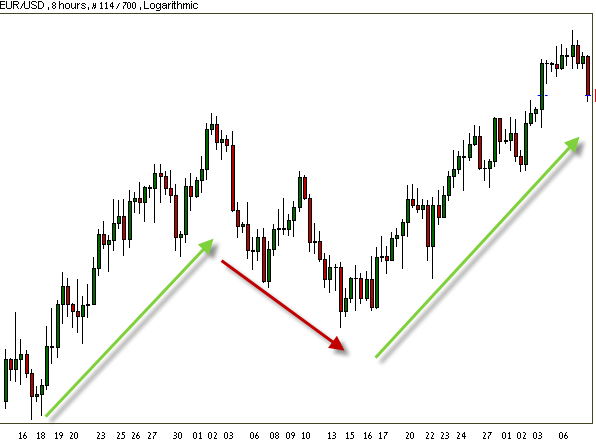 One more standard trend:
 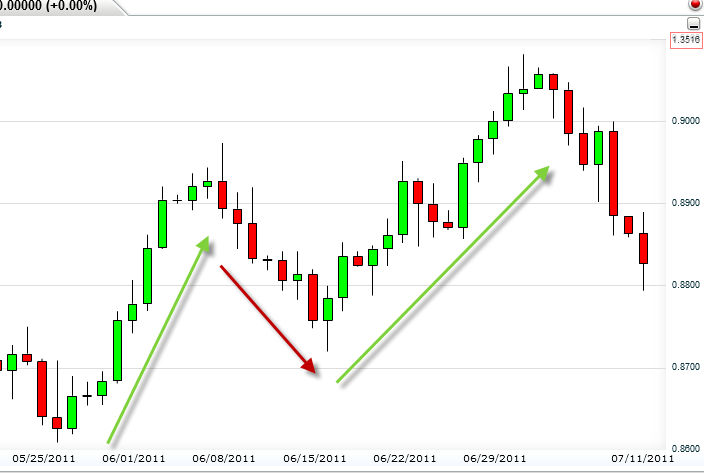 The trend is made up of three waves. It has a general direction (in this case- up), but along the way, a sudden drop takes place, before moving back up again. This drop is called “pullback”. Fibonacci examines pullbacks. Pullback (Corrections): Prices drop following major bullish trends. A pullback is characterized by a relatively minor sequence of bearish bars, before prices move back up. Pullbacks are excellent entrance opportunities to utilize market conditions. You can notice three great entrance opportunities (after each pullback) in the following example of a pullback:
 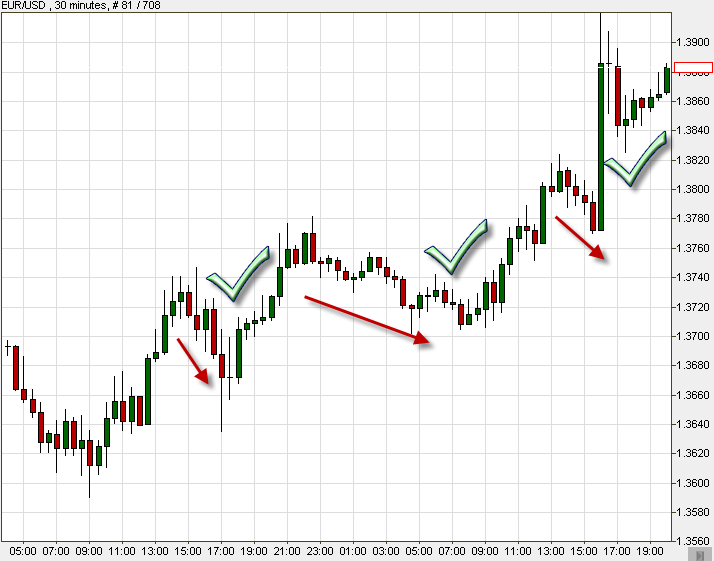 The big challenge is to decide, in real time, whether the trend on the chart shows a correction (pullback) or a change in the trend’s direction and the beginning of a price decreases. It is hard to make a real time decision under such terms. However, we can think of an extremely helpful tool for these exact conditions. Guessed it? Fibonacci to the rescue! Fibonacci helps us determine the extent of the correction. Let’s go back to Fibonacci and his ratios. According to the series we have presented to you, there are a few extremely essential ratios for you to remember. These ratios will help you make smart decisions: The three most important ratios to remember are: 0.382, 0.500 and 0.618 Two other ratios worth remembering are 0.764 and 0.236. Important: You do not need to do any calculations at all! A trader’s life is easy – the trading platforms calculate it all for us, presenting the ratio lines themselves. All that is left for you to do is to use the Fibonacci indicator, which you can find on the top left side of the MT4 platform, see how the lines that represent the ratios fit on the chart, and finally, make a trading decision! Ratios actually serve as support and resistance levels. In other words; buy and sell levels. Fibonacci levels form when market forces respond to pullbacks. Fibonacci ratios are lines drawn on the chart. These ratios help us decide if a reversal is about to form, pulling the price back to the original, general trend. Important: Fibonacci is most effective in volatile markets, with many trends. Let’s take a look at a pullback (correction) again, but this time, with Fibonacci ratios on the chart:
 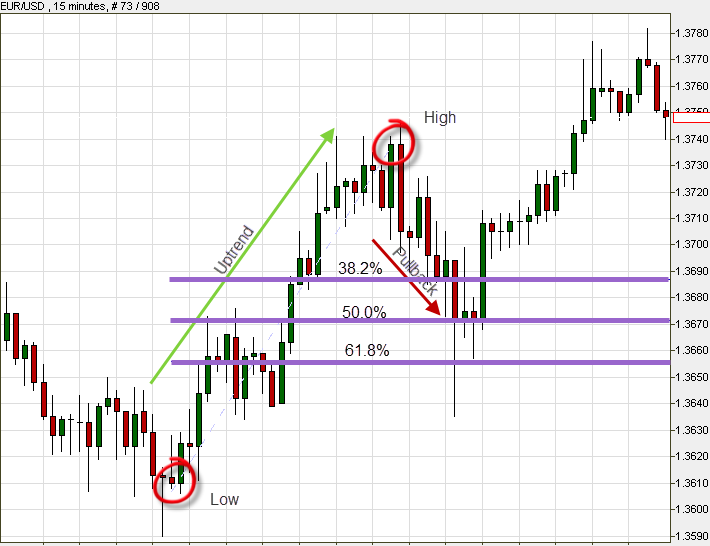 You can see a massive uptrend, with a correction that starts at the trend’s peak. 0.382, 0.500 and 0.618 are the three ratios presented on chart. The correction is located just above 0.5 (plus a couple of shadows at 0.618). This is a healthy status, signaling to prepare ourselves once again for a bullish trend – an uptrend. If the price goes beneath the 61.8% level, the correction will not be clear, meaning, there is a high probability of a downtrend coming. In this case, we will not enter a trade, expecting the price to go up, but rather treat this correction as a selling signal, with good chances for a bearish trend to develop.
 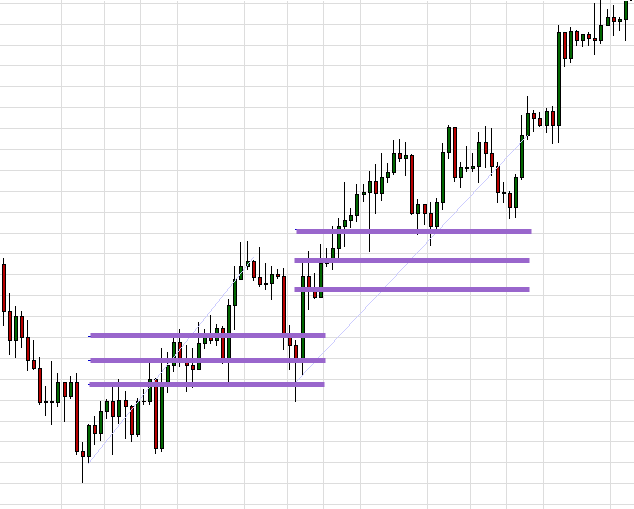 Notice the two corrections forming on the forex chart above (EUR/JPY). The first correction goes down to 0.500 (With a slight tendency to 0.618), and the second goes down to 0.382. In both cases the price went back to going up, continuing the general uptrend. Example of the Fibonacci trading strategy on the USD/CHF chart:
 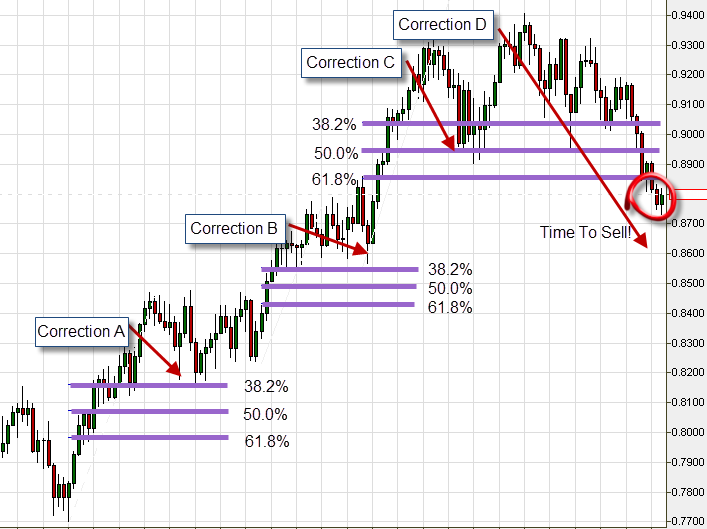 You can see that the first pullback (Correction A) touches the 38.2% retracement line, and the trend continues. Second pullback (Correction B) doesn’t even get near the Fibonacci lines, and the trend continues. The third pullback (Correction C) reaches 50.0%, and turns back up. At last, the fourth pullback (Correction D) cuts across all the Fibonacci lines, going below 0.618. It is time to SELL! Still have not had enough? Let’s examine the next example of the Fibonacci strategy on the EUR/USD chart:
 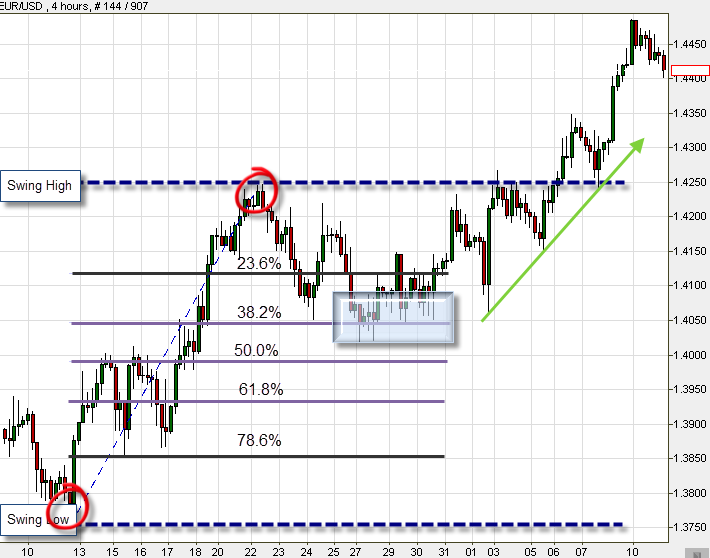 You can observe all Fibonacci ratios on the chart. The trend begins at the Swing Low (The current trend’s bottom point). When the trend reaches the Swing High (Top point), a pullback starts, going all the way to a ratio of 0.38. At this point, we witness a reversal, again. Is there anything we can conclude from this? Of course! Switching back to the original uptrend = a fantastic entry point.
Fibonacci Trading Strategy + Support and Resistance:
Trade is a collection of probabilities. With Fibonacci’s help, you can significantly increase your odds. Obviously, you are not the only one watching the charts in real time. There are thousands of traders looking at the exact same, live chart, thinking about the same position, wondering what to do next. Likewise, many other traders notice the supports and resistance levels, and like you, they will probably buy or sell, according to signals arriving from the market. This is why there is a high likelihood that the market will act like you! 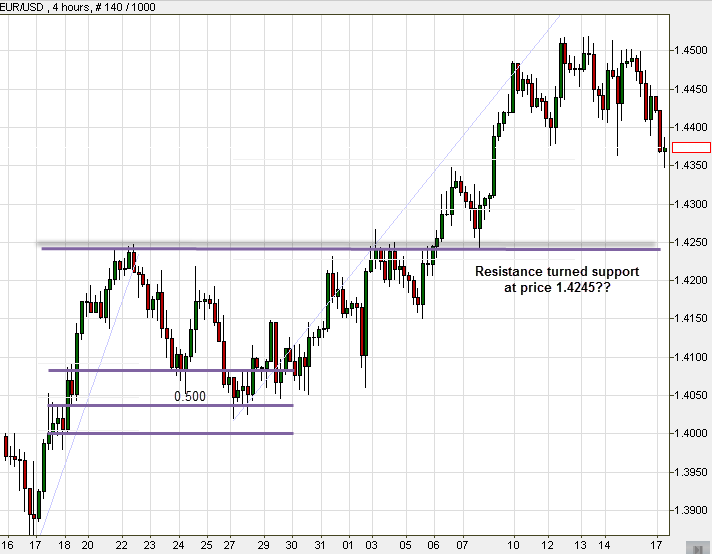 ↓
↓ 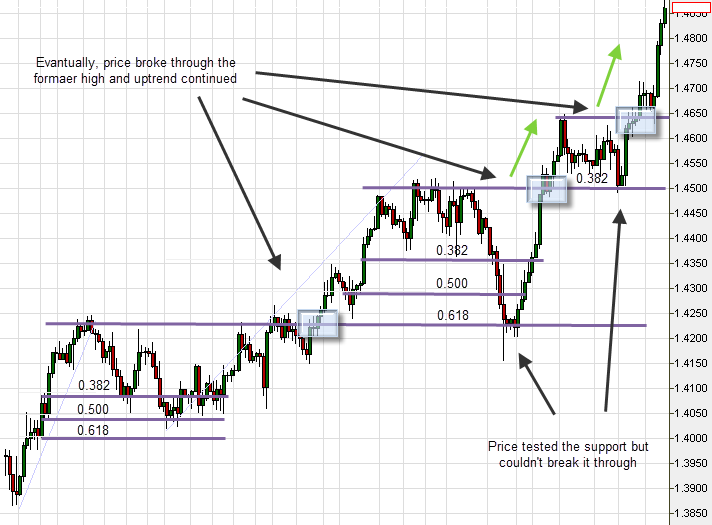 Pay attention to what happened in the two sequential charts above (Pair – EUR/USD): Let’s begin with the first chart. You are looking at an uptrend, meeting a resistance at 1.4245. Correction starts there and stops at price 1.4030, followed by returning to the original bullish trend. This time it breaks resistance with its powerful way up, until its new Swing High, where the price stops, and again starts declining. The question is, to which point? What is going to happen next? Second chart: Remember what we taught you in the previous chapter – Technical Forex Trading Strategies? In many cases, after having been breached, support levels turn into resistance levels, and vice versa! This also happens with the moving averages trading strategy, as you will see in the coming chapters. If you guessed right, well done! Back to our example, you can see that 50% ratio used to be the previous resistance level before the price broke out and moved up. Now the price starts to correct itself. It drops, breaking 38.2%, reaching 50%, stops and there is a change of direction! You can see that it tries to break this level twice more without success. We are witnessing our new support level! It must be a good entry point (unless you have already opened a position, in which case leave it open!). Finally, you can see that the price has also succeeded in breaking the current resistance level, what have we got? A massive, sharp uptrend! Hurray!
- To put matters in proportion – take the example above: If you had invested 10,000 Euros and leveraged it by x2, you would have made in less than a month more than 20% in returns- more than 2,000 Euros! On just a single trading action alone!! Not bad…
There are tons of opportunities like this each day! You probably figured out already that we love using Fibonacci’s services. The main reason for this is that the ratios’ constancy on which this tool works is highly reliable. What does this mean? It means that smart use of this tool can dramatically raise our chances of leaving a session with profits!