There are several popular trading styles. Each style has its criteria and pattern. Trading style can tell a lot about the character of the trader himself. Each trader should choose their trading style or trading strategy after self-evaluation and learning. You should figure out whether you like or hate risk, or whether you have enough trading experience to match a particular style. Examine your preferences, risk/reward ratio, what ratio you are willing to accept between profits and losses, etc. There are aggressive traders, and there are calm ones. There are traders who are satisfied with small profits on each trade, and those who chase the big wins. Each trader is unique. There is no “best or worst style.” Each has its own pros and cons. That said, we will recommend some popular styles which, in our opinion, are well-suited for beginner and novice traders. Let’s get started:
- Scalpers: Intraday trading. This is a very fast-paced trading style, full of action and excitement. The Scalping Trading Strategy belongs to the “short-term trading” category. Time frames for this type of trading are 1-minute, 15-minute, and 10-minute charts. Scalping requires a lot of energy and is a stressful trading strategy. It offers many trading opportunities which you can take advantage of during work breaks or in the afternoon.
- Day Traders: Categorized as a short-terming style. Traders operate in one daily trading area. Day traders usually enter trades when trading hours start and exit just before the end of the daily session. It is a more relaxed style than scalping but day trading is also considered quite jumpy. This style requires background preparation and upfront analysis, helping the trader decide on a specific pair. As the day goes by, the trader can do more analysis and keep an eye on the charts, checking that all goes as expected, before collecting his profits when trading ends.
Important: Day trading fits traders who can spare a few hours each morning to analyze the markets.
- Swing Traders: This is a longer-term trading strategy. Swing trading can last up to a few days. It fits traders with the patience to wait for profitable market trends to come along. This style requires fewer working hours per day. Swing traders must spend less time sitting in front of trading platforms than the other trader types. Good swingers can work full-time jobs, simply taking an hour or two at the beginning, or better still, at the end of the day, to analyze the market and decide on how to act the following day. Swinging is usually safer and sticks to longer trends (most trends last a few days or more).
Important: There are many reversals and changes in a trend’s direction throughout its life. That is why it is important for a swinger to trade with confidence and stick to longer-term analysis if he believes that, in the long term he is right. In other words, do not let short-term distractions manipulate or disturb your plans.
- Position Traders: This is one of the longest-term trading styles. In this case, trades can last a few months, even a year! It suits traders who are very patient and familiar with the Forex “rules of the game. “ We are talking about experienced, professional traders. In many cases, position traders follow the fundamental economic events only (we will get into this in the “fundamental lesson”). In addition, the position style belongs to “heavier” traders who trade high capital amounts- starting with $10,000 and up.
Important: To trade positions, one must understand global economics. You need to stay calm and disciplined, and most importantly, be extremely positive in your trading strategy and analysis. You cannot let disruption of any kind (like trends reversals or losses) blur your vision of the general picture – the framework trend.
Multiple Time Frames Strategy
This is a highly influential trading method! Frankly, you will use a lot of it in your future trades. Multiple time frames is a tracking method on a single pair, but in different time frames. Charts of the same pair look completely different in different time frames. Selecting the right time frame is subjective for each trader, and it is one of the trader’s most important decisions. We already noticed that along a trend there is a series of peaks and lows. Look at the following forex chart: 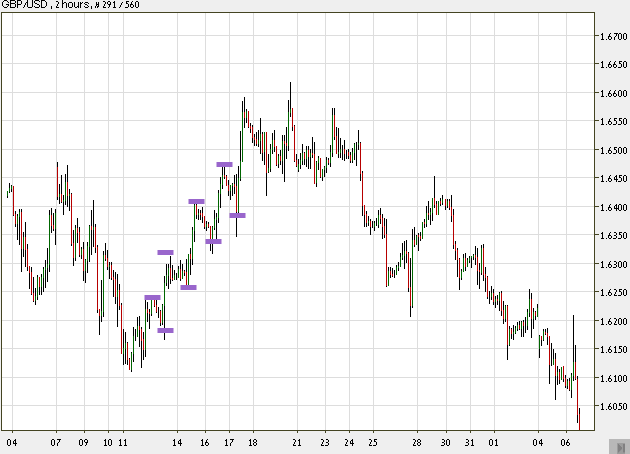 This is a monthly trading chart. The time range of each candlestick in this chart is 2 hours. You can count a total of 360 candlesticks, equal to 1 month. Take a look at the left part and notice the peaks and lows marked as mini-trends (called secondary trends or ‘trends within a trend’), and also notice the general trend direction going up. If we had chosen to look at the same trend but in a different time frame, say of 5-minute ranges in a 2-hour frame (meaning that each stick represents 5 minutes, and a total of 24 sticks in the chart), we would have gotten only a partial picture, showing only a small part of the general uptrend. Assume we wish to take a look at 1-day time ranges (each stick represents one day) in a year frame (182 sticks) – the chart above would turn into a minor inner part of the whole six month chart:
 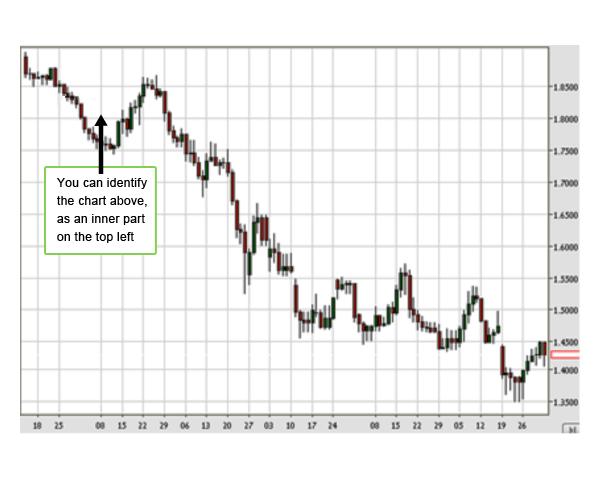 See what just happened?? A trend that clearly looked like an uptrend in a monthly chart turned out to be the beginning of a major downtrend in a 6 months chart! Conclusion: You must always examine a trade on a number of time frames, in order to get a wide, clear, general view of the market! Multiple time frames also help us figure out when to enter and exit trades (waiting for critical points). Check out the following forex chart:
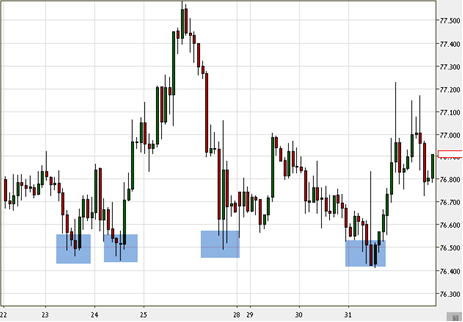 You can see an example of a chart that helps us determine when to either enter or exit. Tip: 15-minute, 30-minute, and 1-hour time ranges (where each stick represents the trading activity of 15 minutes / 30 minutes / 1 hour) are good, with average timeframes, in the middle. They are short-term, but not too short, profitable but not too risky, and allow enough time and significance for the trader to analyze and evaluate markets. Tip: It is advised to practice on different time frames in your practice accounts, before moving into trading with a real account.
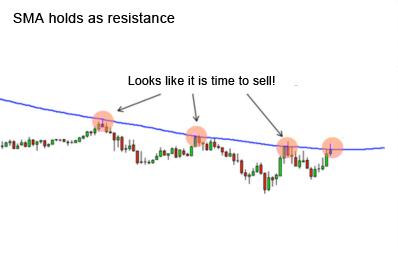
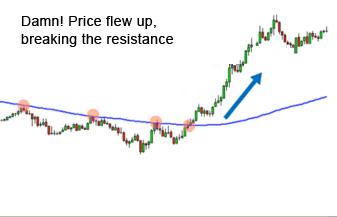
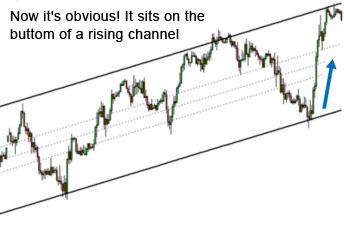 Looking at the top left graph, we would have gone short (sell), because as you can see it looks like the price reached a resistant peak, and from there it was supposed to go down again. But on the following chart (top right picture), we can see that we should have gone long (buy) because we can notice that the price breaks the barrier and moves up drastically. If we had looked at different time frames (bottom), we could see that the chart’s present position in a long-term channel is at the bottom of the channel (bottom left picture), waiting to move up (Plus, notice the Doji which appears in the last low point. You learned that Doji informs trend reversal, remember?). Tip: The more comprehensive the time frames we choose, the stronger and safer trading signals we get from the market. Recommended working method: When using a certain time frame, you should always test yourselves with the next-in-line time frame. Even the usage of 3 time frames simultaneously is good, but do not go too far. Trying to follow too many charts at the same time will get you seriously confused! To sum up, working with multiple time frames is most risky if you are a scalper. Due to the speed of price changes and the need to make quick decisions, this method is complicated for scalpers and requires a lot of training. If you are a scalper, do not work with 3 time frames at the same time. Use two maximum. Example: The following charts represent 3 different time frames of the same forex currency pair, at the same time. You can see that all three indicate a great buying opportunity! Daily Japanese candlestick chart (each candle represents one day):
 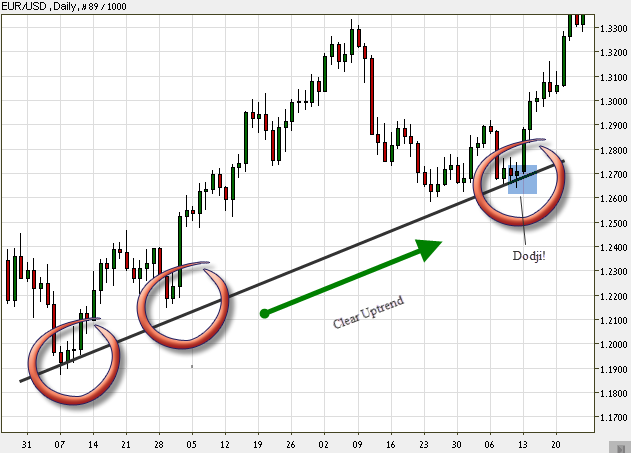 2-hour Japanese candlestick chart (each candle represents 2 hours):
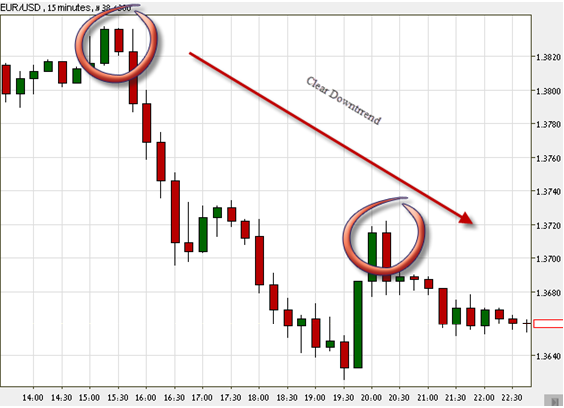
 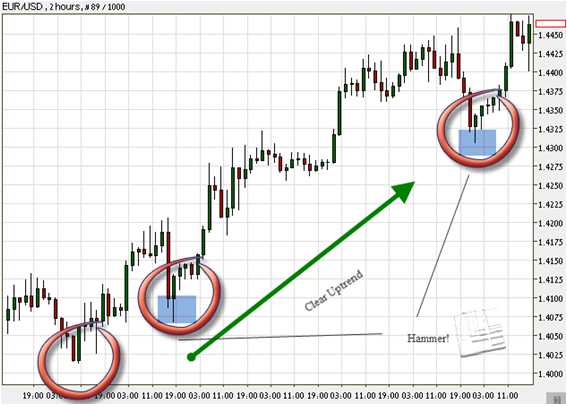 A 15-minute Japanese candlestick chart (each candle represents 15 minutes):
In Conclusion
Long-term charts – help you understand the bigger picture. Medium-term charts – present a current picture of what’s going on at the moment and show trading opportunities. Short-term charts – help you determine good entry and exit points.