Currency Correlation (Fundamental Strategy)
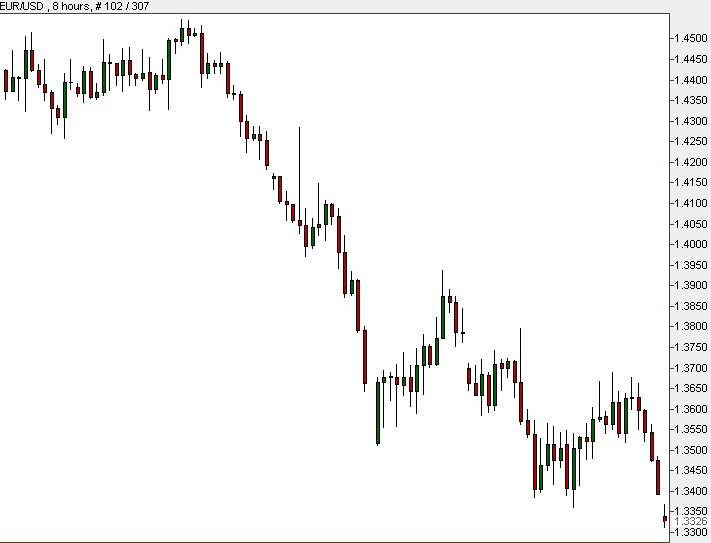
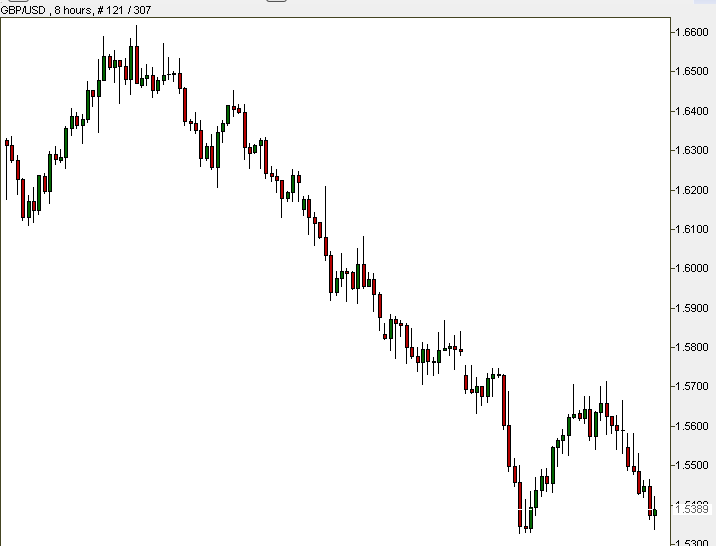
Play your currencies like a game of chess The different currency pairs maintain complex relationships amongst themselves. In some cases, closer and tighter, and in others distanced and indirect (like third cousins). Correlation measures their relationships. In other words, it refers to the connection between two pairs – how a certain pair will react to another pair’s movement. Sometimes correlation is positive, and sometimes it is negative. Important: There is always a relationship between 2 pairs. There is no single pair that is entirely isolated from all other pairs. Correlated currencies are also great for a hedging trading strategy. Experienced traders usually open more than one position simultaneously (trade on 2 or more pairs at the same time). After you practice for a couple of days you will turn into a better trader and then you will probably wish to open more than one position each time. That is why it is necessary to be aware of these relationships! Trading with several pairs at the same time is excellent for reducing risks. Calculating Correlation fluctuates on a scale from 1 to -1. 1 describes a perfect positive correlation (100% correlation) between the two pairs. Pairs with correlation 1 move in the same direction 100% of the time. When correlation equals -1, it represents a perfect negative correlation between two pairs. Two pairs are moving in opposite directions 100% of the time. Indices such as FTSE 250, NASDAQ, DAX, etc. are usually positively correlated and may vary from 0.5 to 1. Within these, though, some of the companies listed in these stock exchanges might be correlated negatively, depending on the industry. For instance, companies that specialize in travel technology develop new motors or engines that use less fuel or none at all. So, when these companies build new engine models and minimize fuel consumption, the share price of these companies go up, while the share price of the oil companies declines. We can say that the correlation between the two industries is negatively correlated. A correlation equaling 0 indicates no visible connection between two pairs. In that case, it is impossible to draw any conclusions about the influence of one pair on the other. Important: You do not have to calculate anything! There are financial sites that do all the work for you by presenting correlation tables after calculating the ratios. The only thing you are left to do is to read the data in the table. For example, let’s watch the levels of correlation between EUR/USD and the other major pairs for different time frames (as of 13 April 2020):  From the table: You can see, for instance, that the correlation between EUR/USD and USD/CHF is either highly negative or highly positive, throughout all presented periods in the table (besides for one or two periods). What does this mean? Say you wish to trade on these 2 pairs – do not open two forex signals or 2 trades moving in the same direction (meaning, both will go bullish or bearish), unless you are using the hedging strategy, but rather in opposite directions. If you think of buying one pair, you should sell the other. Due to their tight connection (very strong correlation between them), we wouldn’t actually trade these two pairs simultaneously. It will not cause any reduction in your risks! In fact, a move like this will raise your risk! It would be much better to divide your trades between pairs with partial correlation. Example: That’s how EUR/USD (left chart) and GBP/USD (right chart) looked like, in an 8-hour chart (total period of 1 month). Go to the table: you can see that the correlation between them is 0.96, almost a perfect positive. Now you understand why their charts are practically identical. It would not be smart to trade in both of these pairs because it will only increase our risk. Think of it, it would be just like buying two packages of the same pair!

- It is not recommended to trade pairs that have perfect positive/negative correlation, or even almost perfect. There is no point in buying one pair while selling the other, thinking “now I have a balanced plan”. It is like buying a pair and at the same time selling it for a similar price. And, you would pay a double commission because you pay your broker for two positions!
- Remember: Correlations change in different timeframes. Take a look at our table. The weekly correlation between EUR/USD and GBP/USD equals 0.96, while the monthly correlation between the same pairs equals 0.42! You should be very aware of these changes. Correlation ratios are changing due to fundamental reasons’ among them changes in interest rates, political events, and other causes.
- Don’t forget that news about a certain pair might have effects on other currencies (and therefore on other pairs).
- Correlation helps us spread and reduce risks.
Tip: Divide your trades in pairs with strong (but not very strong) correlation. Good ranges are 0.5-0.7 and -0.5 – -0.7. Tip: It allows you also to test given forex trade signals on a certain pair. If you believe that a certain pair is about to break on the chart, you can examine the chart of a similar pair to see what is going on there. Typical same direction moving currency pairs:
- EUR/USD and GBP/USD
- EUR/USD and AUD/USD
- EUR/USD and NZD/USD
- USD/CHF and USD/JPY
- AUD/USD and NZD/USD
Typical inversely moving pairs:
- EUR/USD and USD/CHF
- GBP/USD and USD/JPY
- USD/CAD and AUD/USD
- USD/JPY and AUD/USD
- GBP/USD and USD/CHF