Bollinger Bands
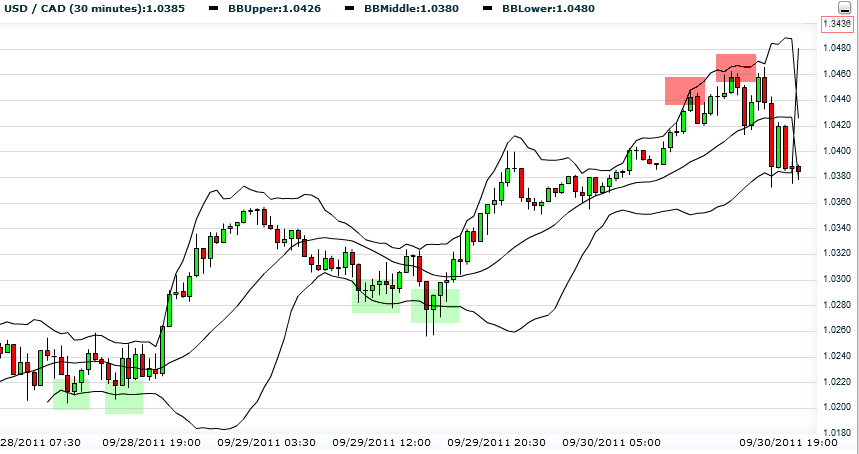
A slightly more advanced tool, based on averages. Bollinger Bands are made of 3 lines: the upper and lower lines create a channel that is cut in the middle by a central line (some platforms do not present the central Bollinger line). Bollinger Bands measures the market’s instability. When the market is proceeding peacefully, the channel shrinks, and when the market gets frantic, the channel expands. Price constantly tends to revert to the center. Traders can set bands’ lengths according to the timeframes they want to watch. Let’s look at the chart and learn more about Bollinger bands:  Our signal is when the price reaches one of the bands (top and bottom lines). Notice on the chart that when the price touches a certain band twice, the signal gets stronger. In our case you can identify a double touch on the bottom band (marked by green boxes) – this is a BUYING signal; and a second double touch on the top band (red boxes) – a SELLING signal. Tip: Bollinger Bands operate as supports and resistances. They work fantastically when the market is unstable and it is hard for traders to identify a clear trend.
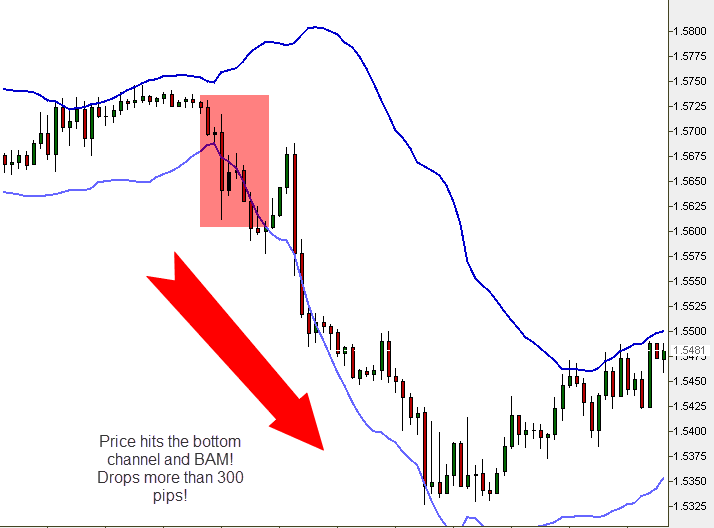
  Bollinger squeezing – Great strategic way to examine the Bollinger Bands. This alerts us to a massive trend on its way while it gets locked on early breakouts. If sticks are starting to poke out on the top band, beyond the shrinking channel, we can guess that we have a general future, upward direction, and vice versa! Check out this marked red stick that is poking out (GBP/USD, 30-minute chart):
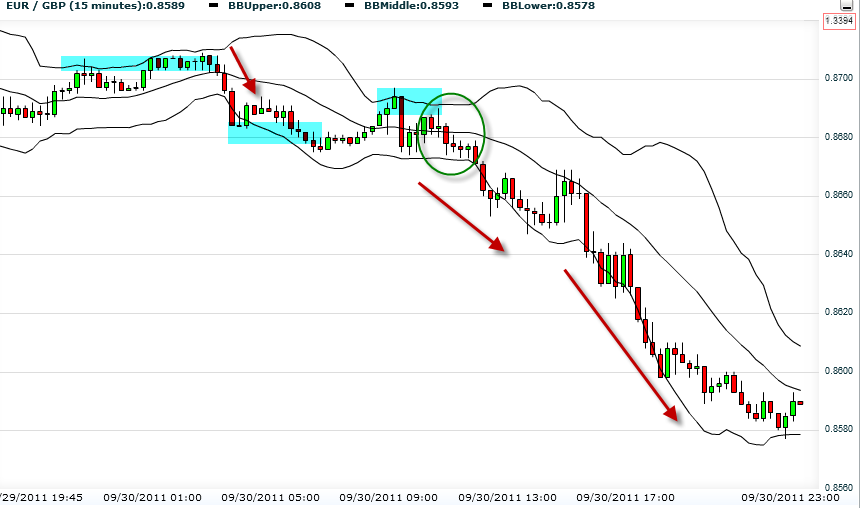
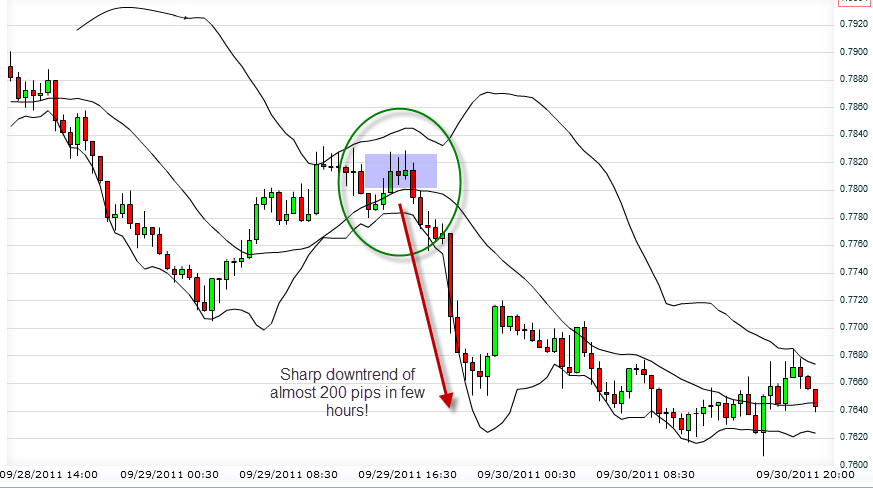
  In most cases, a shrinking gap between the bands informs us that a serious trend is on the go! If the price is located below the centerline, we will probably witness an uptrend, and vice versa. Let’s see an example:
  Tip: It is advised to use Bollinger Bands on short timeframes like a 15-minute candlesticks chart.