ADX (Average Directional Index)
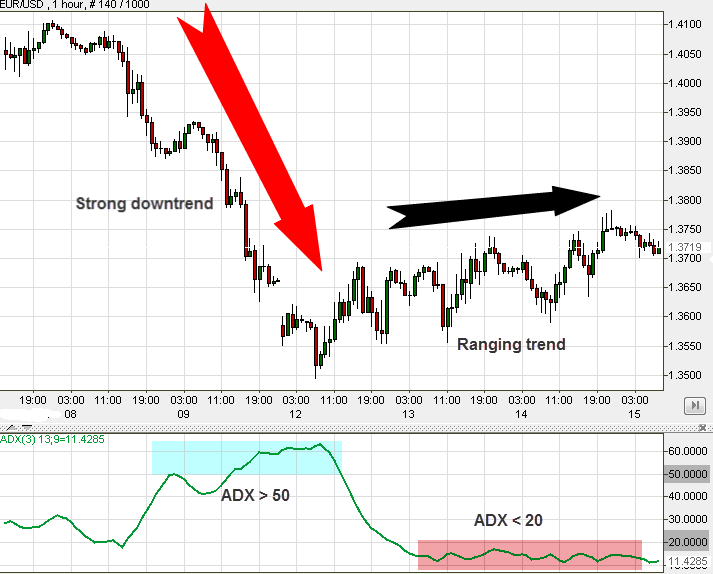
The ADX tests a trend’s strength. It also operates on a 0 to 100 scale. It is shown below the charts. Important: ADX examines the trend’s strength rather than its direction. In other words, it checks whether the market is ranging or going on a new, clear trend. A strong trend would put us above 50′ on the ADX. A weak trend would put us below 20′ on the scale. To understand this tool, take a look at the following example. Example of the EUR/USD using ADX trading strategy:  You will notice that while ADX is above 50′ (highlighted green area) a strong trend exists (in this case – a downtrend). When ADX drops below 50′ – the downfall stops. It might be a good time to exit the trade. Whenever ADX is below 20′ (highlighted red area) you can see from the chart that there is no clear trend. Tip: If the trend goes below 50′ again, it might be time for us to exit trading and rearrange our position. ADX is effective when deciding if to exit at an early stage. It is mainly helpful when integrated with other indicators that point to a trend’s direction.